|
Our
Introductory Holiday Special will expire on January 1st
Signup today and save 50% on all our Membership Packages
which include our Stocks to Watch List and Daily Breakout Reports
Weekend Stock Market Analysis
(12/27/03)
I haven't talked about the Contrarian Indicators in a while
however I'm a little concerned with the Put to Call Ratio as it's hinting that a
possible pullback may occur in the near term. Notice over the past year
when the Put to Call Ratio has dropped below .60 (point A) that some selling
pressure has occurred (points B) in the S&P 500 with varying degrees of
intensity. It looks too me if the S&P 500 does come under some selling
pressure in the near term that it could pullback to the 1060-1065 area which is
along its upward sloping trend line (red line) originating from the May
low. 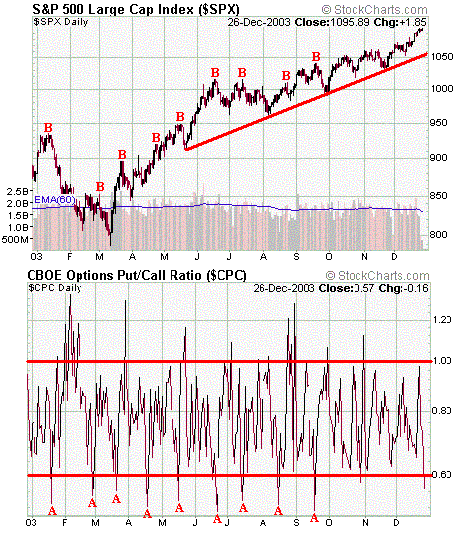 Meanwhile upon further analysis you
will also notice that that the 1060-1065 area is also were the S&P 500's 10
Weekly EMA (blue line) and longer term 38.2% Retracement Level reside at as
well. Thus the 1060-1065 zone appears to be a key support area for the
S&P 500 if a pullback does happen. In the longer term the S&P 500
still has a chance to rally up to the 1155-1170 area which coincides with its
50% Retracement Level (1155) and high made in 2002 near 1170. 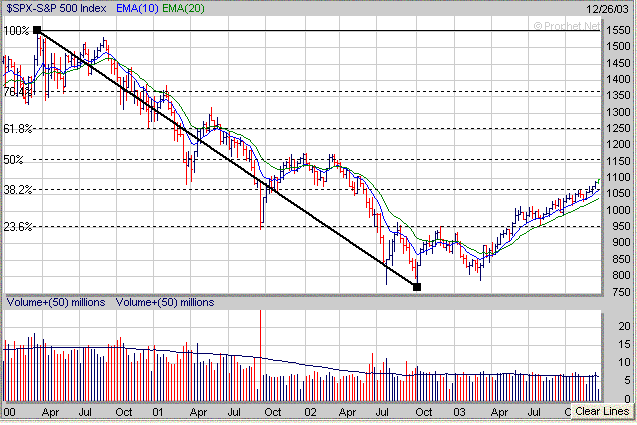
As
for the Dow it has become fairly stretched away from its 10 Weekly EMA (blue
line) and could also be close to a pullback as well. The last time the Dow
was stretched this far from away its 10 Weekly EMA was back in June (point C)
which was followed by a pullback of around 450 points as it found support at its
10 Weekly EMA (point D). If a similar pattern develops this time around I
would look for support in the 9990 to 10000 range which coincides with the Dow's
rising 10 Weekly EMA (9900) and longer term 61.8% Retracement Level
(10000). In the longer term there is still a chance the Dow could rally up
to the 10700 level which is the 76.4% Retracement from the early 2000 high to
the October 2002 low and also coincides with the high made in
2002. 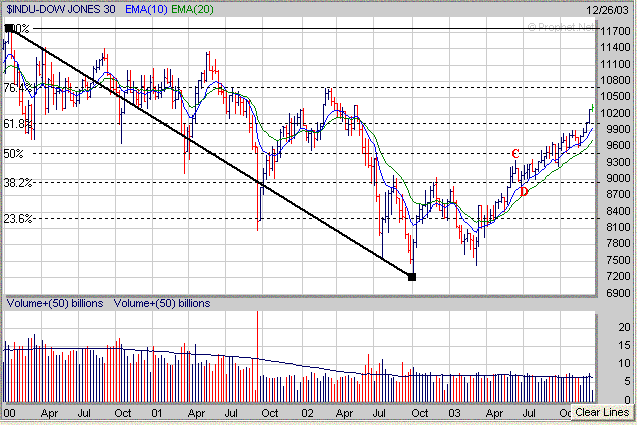
As for the Nasdaq it still remains
in a trading range between 1880 and 2000 which has been going on for almost 3
months now. Eventually the Nasdaq is going to break out of this trading
range and make a substantial move in one direction or the other. If the
Nasdaq can break above the 2000 level this should lead to a quick move up to the
2050-2100 range which coincides with its longer term 23.6% Retracement Level
(2050) and high made in the early part of 2002 near 2100 (point E).
Meanwhile if the Nasdaq breaks below the bottom of its trading range near 1880
which is also around its 20 Weekly EMA (green line) then look for a quick drop
back to its 40 Weekly EMA (purple line) near 1760 (point F). 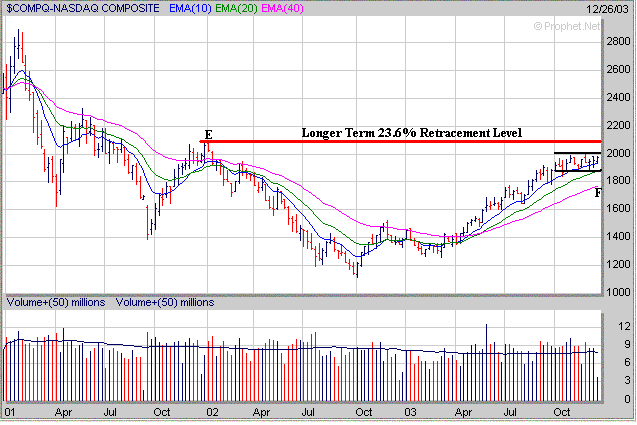
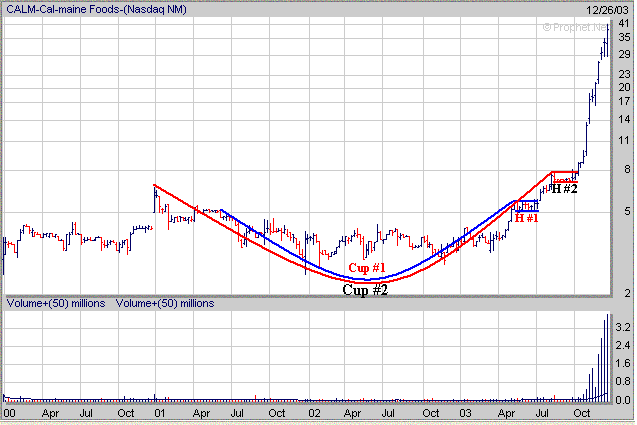
Historically the best performing
stocks exhibit strong Sales and Earnings Growth before and after breaking out of
a favorable chart pattern. CALM is a good example of a stock which has
been exhibiting strong Sales and Earnings Growth over the past year and is one
we featured last June in our Weekend
Analysis for June 7th. Notice in this example CALM developed two
separate "Cup and Handle" patterns. CALM broke out of its 1st
Cup and Handle (H #1) pattern in July of this year and rose from $5 to $8.
CALM then developed a 2nd Cup and Handle (H #2) pattern before breaking out
again in October and has risen from $8 to $41 for a gain of nearly 400% during
the past 3 months. 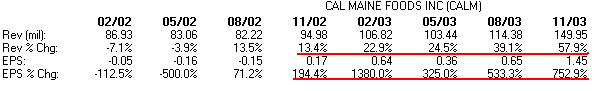
How can a Premium Membership to amateur-investor.net
benefit you as an investor? We focus on stocks which are exhibiting
favorable Sales and Earnings Growth that have developed a favorable chart pattern such as a "Cup and Handle",
"Double Bottom" or "Flat Base". These stocks are then
included in our "Stocks to Watch List" which gives investors a
quick reference to those stocks which may provide the best buying opportunities in the weeks ahead. Each stock in
our "Stocks to Watch List"
includes specific Buy Prices, Stop Loss Prices (very important) and projected
Target Prices.
Signup
Today for a "Free" Trial Membership and see our complete list of
Stocks
which are currently developing a favorable Chart Pattern such as the
"Cup and Handle" or "Double Bottom"
Amateur-Investor.net
|

