|
Introductory
Special for the Holiday's
Signup today and save 50% on our Membership Packages
which include our Stocks to Watch List and Daily Breakout Reports
Weekend Stock Market Analysis
(12/6/03)
If there is one sector to watch over the next few weeks it's the
Semiconductors (SOX). If this sector breaks down it spells trouble for the
rest of the market as well. Since April the SOX hasn't dropped below its
20 Weekly EMA (same as 100 Day EMA on a daily basis) as it has been trending
higher. Right now the SOX is just above its 10 Weekly EMA (same as 50 Day
EMA on a daily basis) which is around the 490 level. If the SOX fails to
hold support near its 10 Weekly EMA then it will likely drop back to its 20
Weekly EMA which also coincides with its longer term 23.6% Retracement Level
near 470. The 470 area is a critical support zone for the SOX and if this
level doesn't hold that could spell trouble for the entire market down the
road. 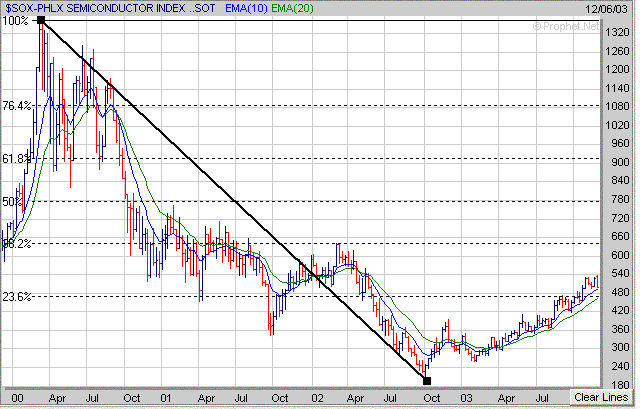
As
far as the major averages the Dow still hasn't been able to break above its
longer term 61.8% Retracement Level which is around 10000. If the Dow is
going to make another significant move higher in the weeks ahead it will have to
break above this longer term resistance zone. Meanwhile if the Dow comes
under some selling pressure there are two areas of support to watch. The
first is at its 10 Weekly EMA (blue line) near 9700 and the second is at 20
Weekly EMA (green line) near 9550 which is also coincides with its longer term
50% Retracement Level. As I have pointed out before since April the Dow
hasn't dropped below its 20 Weekly EMA while remaining in its upward trend. 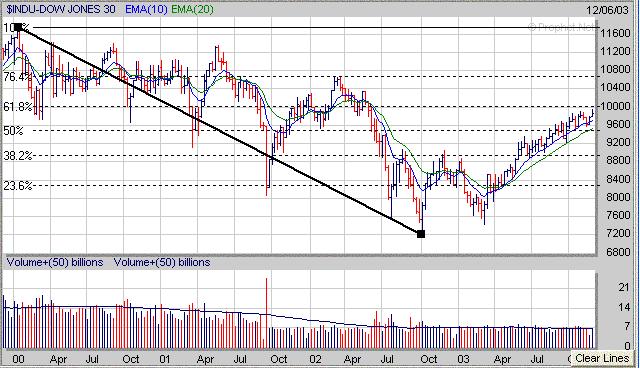
The
Nasdaq appears to have stalled out around the 2000 area which is just below its
longer term 23.6% Retracement Level (calculated from the early 2000 high to the
October 2002 low) near 2050. The key level to watch next week if the
Nasdaq remains under some selling pressure is just above the 1900 level which
corresponds with its 10 Weekly EMA and upward sloping trend line (black line)
that originates from the March low. Since late March the Nasdaq has been
able to find support near its 10 Weekly EMA as it has trended higher. If
the Nasdaq fails to hold support near the 1900 level then it could drop back to
its 20 Weekly EMA (green line) near 1850. To the upside if the Nasdaq is
able to break above the 2000 level I would expect significant upside resistance
at its 23.6% Retracement Level near 2050 which also coincides with the high made
in early 2002 (point A). 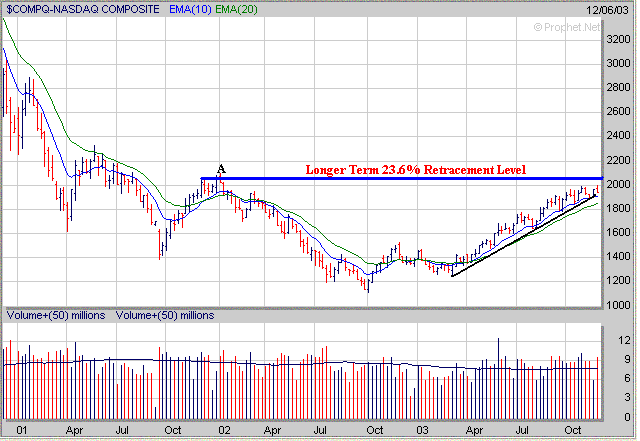
The S&P 500 did
rise slightly above its longer term 38.2% Retracement Level (near 1065) this
past week but closed back below it on Friday. If the S&P 500 remains
under some selling pressure in the near term look for initial support at its 10
Weekly EMA near 1040. 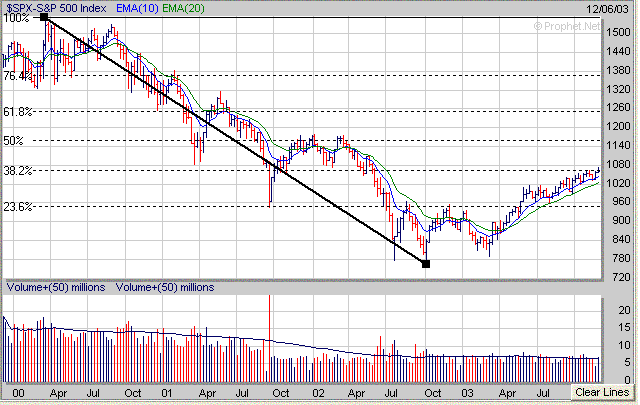
Finally
for those of you watching the Gold and Silver sector the XAU appears to be
stalling out near its longer term 61.8% Retracement Level near 112 (calculated
from the early 1996 high to the late 2000 low) and could be in store for a
pullback in the weeks ahead. Thus I would be leery of investing in any
Gold or Silver stocks in the near term. For the longer term it does
appear the XAU has formed the right side of a long term "Cup"
and now needs to develop a constructive Handle over the next several weeks to
complete a Bullish "Cup and Handle" pattern before making another
significant move higher. 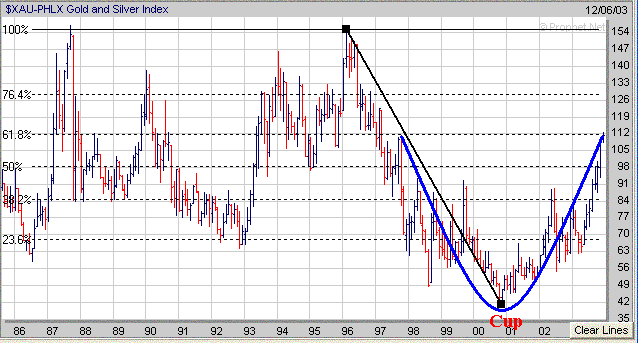
If the XAU does
begin to pullback in the upcoming weeks and starts to develop a Handle I would
look for the XAU to find support either at its rising 10 Weekly EMA near 101 or
at its rising 20 Weekly EMA near 95. 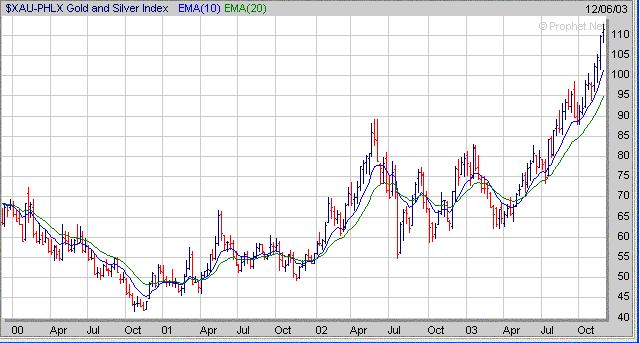
How can a Premium Membership to amateur-investor.net
benefit you as an investor? I use principles derived from "CANSLIM"
to search for stocks to put in my Top 100 List which are then ranked on
several factors including EPS Rank, RS Rank, Group Strength,
Accumulation/Distribution, Net Profit Margins and etc. From my Top 100
List I then narrow the list down further by featuring those stocks which
have developed a favorable chart pattern such as a "Cup and Handle",
"Double Bottom" or "Flat Base". These stocks are then
included in my "Stocks to Watch List" which gives investors a
quick reference to those stocks which may provide the best buying opportunities
over in the weeks ahead. Each stock in my "Stocks to Watch List"
includes specific Buy Prices, Stop Loss Prices (very important) and projected
Target Prices. The Performance of our Stocks to Watch List so far in 2003
is shown below as compared to the major averages.
Performance vs Major Averages
(1/3/03-11/30/03)
|
Amateur Investors
|
+108.6% |
| Dow |
+17.3% |
| Nasdaq |
+46.7% |
|
S&P 500 |
+20.3% |
Signup
Today for a "Free" Trial Membership and see our complete list of
Stocks
which are currently developing a favorable Chart Pattern such as the
"Cup and Handle" or "Double Bottom"
Amateur-Investor.net
|

