|
Introductory
Special for New Members
Signup today and save 50% on our Membership Packages
which include our Stocks to Watch List and Daily Breakout Reports
Weekend Market Analysis
(9/13/03)
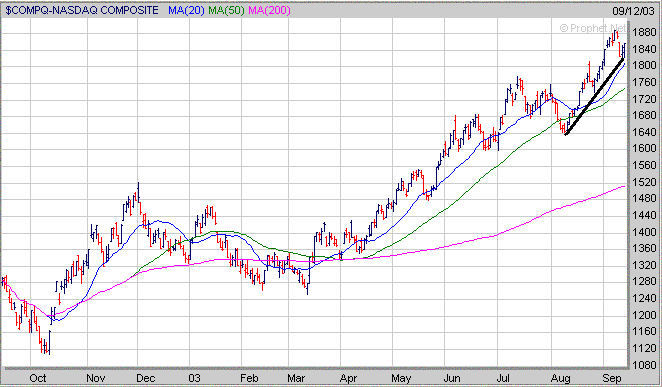
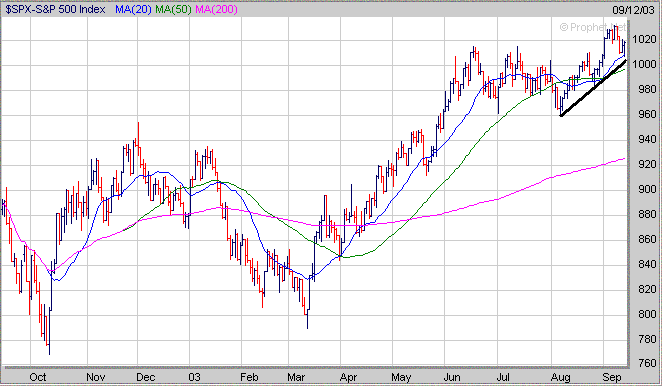
Despite some selling pressure this past week all three major
averages (Dow, Nasdaq and S&P 500) held support near their 20 Day EMA's
(blue lines) and short term upward sloping trend lines (solild black lines)
established from their early August lows.
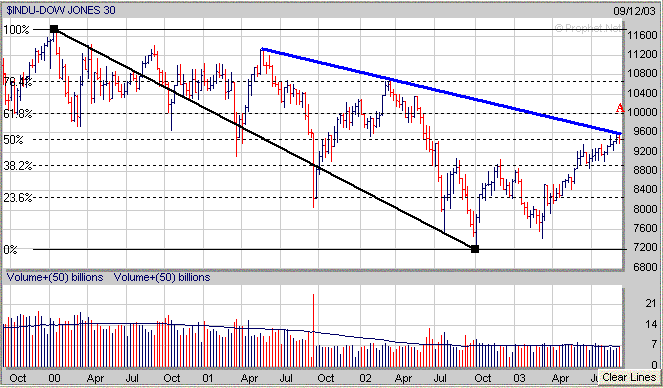
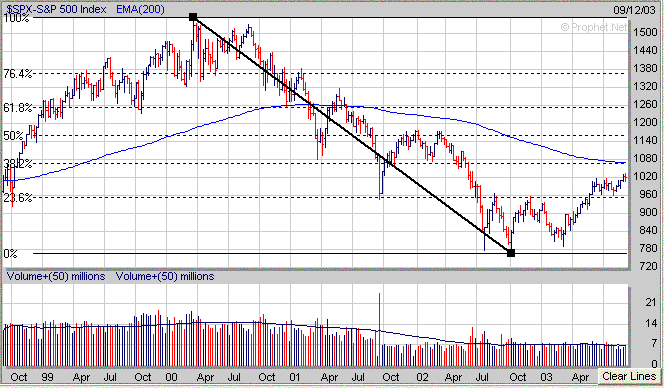
The two key levels to watch next week in the Dow are around 9400
and 9600. If the Dow drops below the 9400 area its next shorter term
support level would be at its rising 50 Day EMA (green line) near
9275.
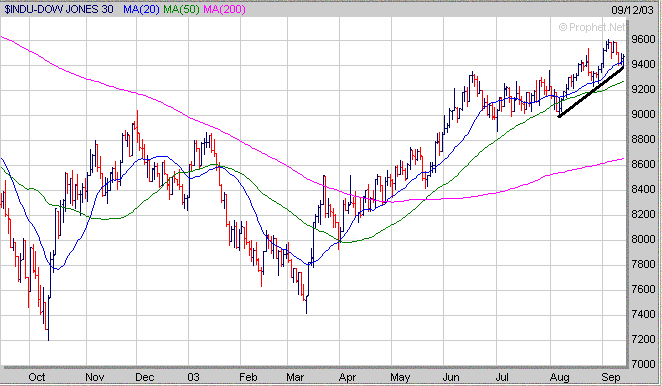
Meanwhile if the Dow breaks above the 9600 level which is along
a longer term downward sloping trend line (sold blue line) originating from the
2001 high then it still has a chance to rally up to the 10000 level (point A)
which is the 61.8% Retracement calculated from the early 2000 high to the
October 2002 low.
As far as the Nasdaq one key level to watch is at its 200
Weekly EMA near the 1900 level. If the Nasdaq can break above the
1900 level then it may rally back to its longer term 23.6%
Retracement Level near the 2050 level.
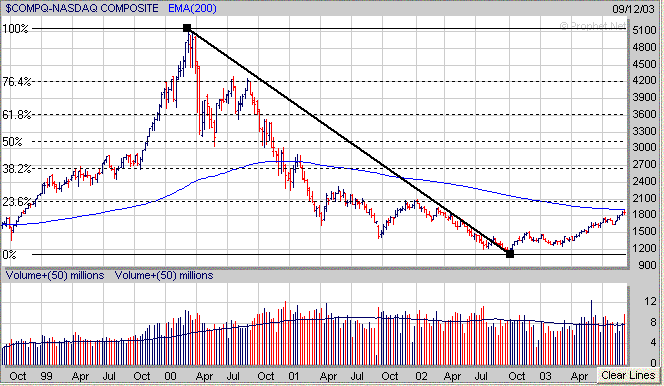
However if the Nasdaq is unable to break above its 200 Weekly
EMA near 1900 and drops below its rising 20 Day EMA just above the 1800 level
then its next area of support to the downside would be at its 50 Day EMA near
1750.
As for the S&P 500 if it can break above the 1030
level then its next major area of upside resistance resides near the 1065 area
which coincides with its 200 Weekly EMA and longer term 38.2% Retracement
calculated from the early 2000 high to the October 2002 low.
Meanwhile if the S&P 500 fails to hold support near its 20
Day EMA then the next short term support area would be at its 50 Day EMA which
is now approaching the 998 area.
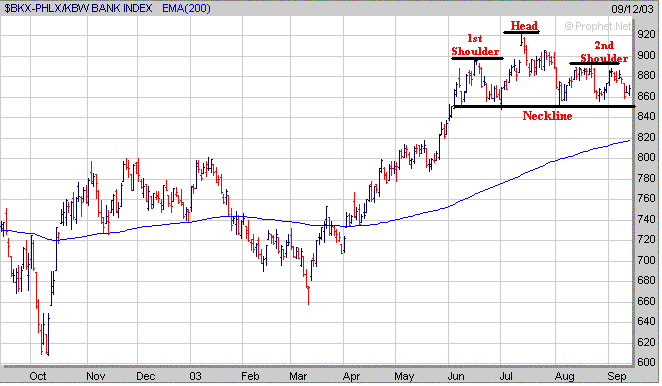
As mentioned last weekend there are two sectors to keep your eye on
which are the
Banks (BKX) and Semiconductors (SOX). The BKX which is heavily weighted in
the S&P 500 is still exhibiting a potential Head and
Shoulders Top pattern. If the BKX can break above its 2nd Shoulder near
885 then this would negate the Head and Shoulders pattern and have
a positive effect on the S&P 500. However if the BKX breaks below the
Neckline near 850 then this could lead to a drop back to its 200 Day EMA near
the 820 level and have a negative impact on the S&P 500.
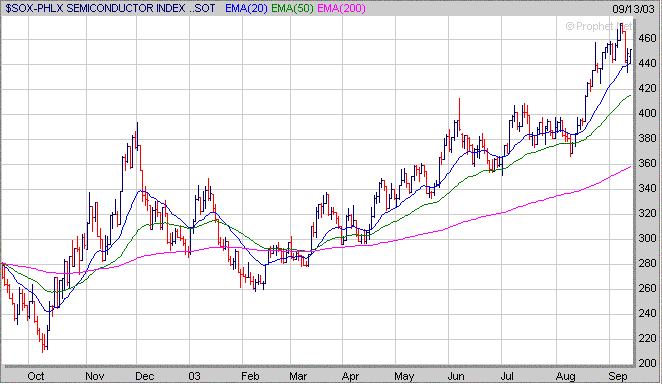
The SOX ran into resistance this past week just below its 23.6% Retracement Level near
480 and the key thing to watch will be if it can
break above this level. If the SOX can break convincingly through the 480 level then
this would have a positive affect on the Nasdaq. As you can see the next
major upside resistance level in the SOX if it clears its 23.6% Retracement
Level appears to be at its 38.2% Retracement Level near 650 which also coincides with
the March 2002 high (point B).
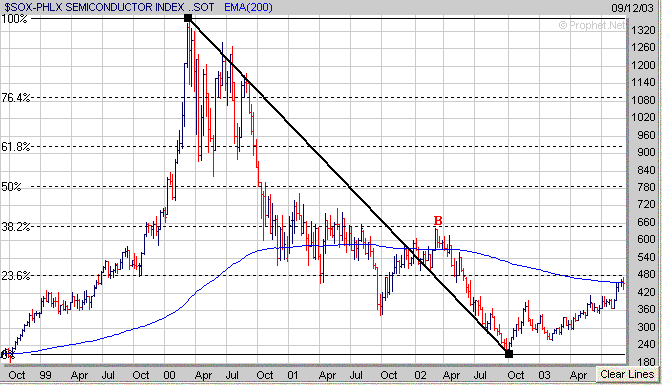
Meanwhile the key short term support level to watch in the SOX
is near its 20 Day EMA around the 440 level. If the SOX drops below this
level then its next support area would be at its 50 Day EMA near 415.
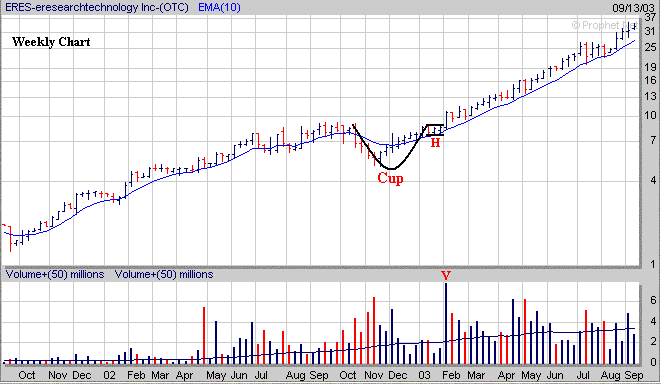
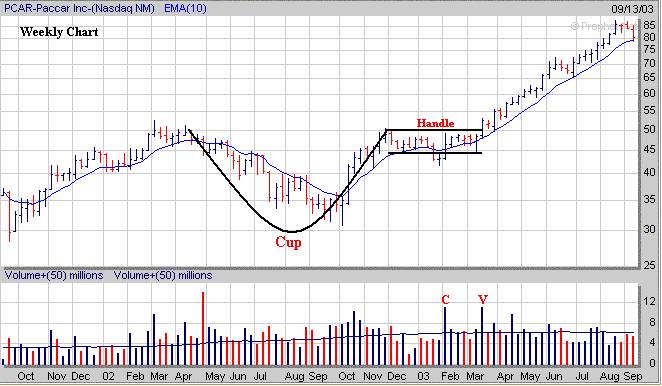
Finally when looking for stocks exhibiting a favorable chart
pattern such as the "Cup and Handle" they can vary significantly with regard to
how long they make take to develop. A few examples are shown below.
In the first example ERES formed a small 3 month Cup followed by
a 3 week Handle (H) before breaking out on huge volume (V) this past
February. Also notice that ERES has been in a steady up trend since then
and hasn't dropped below its 10 Weekly EMA since breaking out.
Meanwhile in the second example PCAR formed a longer Cup (7 1/2
months) and then developed a 15 week Handle before breaking out in March on
strong volume (V). Although PCAR basically traded between $45 and $50
while developing its 15 week Handle notice how it briefly dropped below the $45
level on low volume in January but the Institutional Money came back strongly in
early February (point C). In addition just like ERES notice how PCAR also
held support at its 10 Weekly EMA as it trended higher over the past several
months after breaking out in March.
Signup Today for a
"Free" Trial Membership and see which Stocks
are currently developing a favorable "Cup and Handle" pattern
Amateur-Investor.net
|

