|
Introductory
Special for New Members
Signup today and save 50% on our Membership Packages
which include our Stocks to Watch List and Daily Breakout Reports
Weekend Market Analysis
(9/20/03)
The major averages rallied this past week after consolidating
their gains the week before. For those of you that follow Elliot Wave
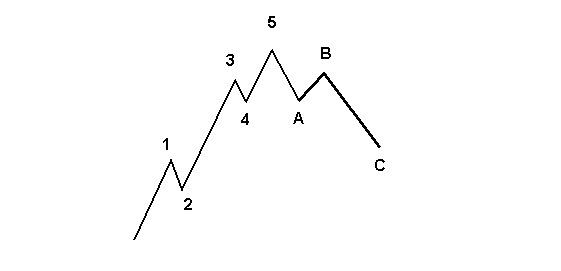
Theory it appears that the Nasdaq is exhibiting a Wave #3 in a potential longer term 5
Wave Pattern. With out getting to technical a brief example of a what an
Elliot 5 Wave Pattern looks like is shown below.
Notice how Waves 1,3 and 5 are upward moves with Wave 3
lasting the longest while Wave 5 is the shortest. Meanwhile also notice
that Waves 2 and 4 are corrective Waves which only last for a brief period of
time before the upward trend continues.
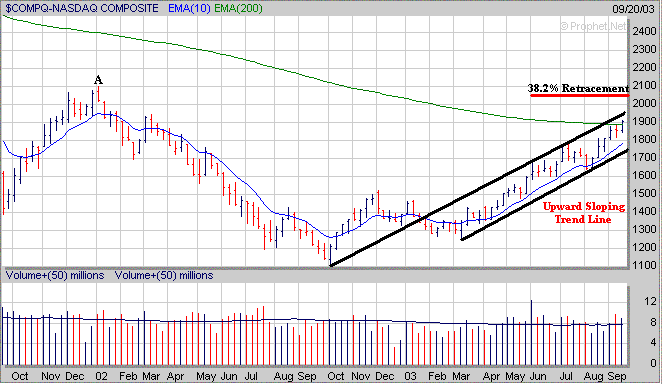
If we look at the current chart of the Nasdaq it appears a
similar pattern is evolving and at some point a corrective 4th Wave will
eventually occur before the final 5th Wave develops. Right now the
question is how much longer will the current Wave 3 last before the corrective
4th Wave develops?

This past week the Nasdaq did close just above its 200 Weekly
EMA (green line) near the 1900 level. Also since mid March the Nasdaq has
been in an upward trending channel (solid black lines) and has been finding
support on every pullback near its 10 Weekly EMA (blue line). In the
longer term there is a significant upside resistance area in the 2050 to
2100 range which coincides with the Nasdaq's 38.2% Retracement Level (calculated
from the early 2000 high to the October 2002 low) and the high made in early
2002 (point A). The question I have is will the Nasdaq develop a
corrective 4th Wave before or after the 2050 to 2100 range is reached? If
a corrective 4th Wave does develop before the 2050-2100 range is reached the
support range to watch would be in the 1750 to 1790 area which coincides with
the Nasdaq's rising 10 Weekly EMA (1790) and upward sloping trend line from the
March low near 1750.
As for the Dow if it continues higher there is a significant
upside resistance area near the 10000 area which coincides with the longer term
61.8% Retracement Level (calculated from the early 2000 high to the October 2002
low). Also notice the Dow has been finding support near its rising 10
Weekly EMA (blue line) since last March so if it encounters some selling
pressure instead I would look for initial support near the 9400
level.

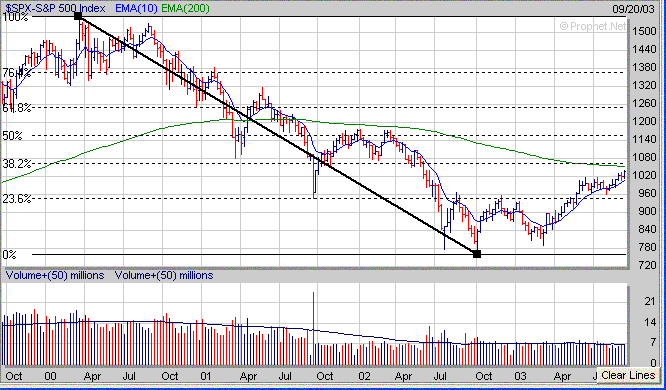
The S&P 500 is nearing two possible upside resistance levels
which are near its 200 Weekly EMA (green line) around 1050 and at its longer
term 38.2% Retracement Level near 1065. It will be interesting to see if
the S&P 500 stalls out near one of these two levels over the next week or
two.
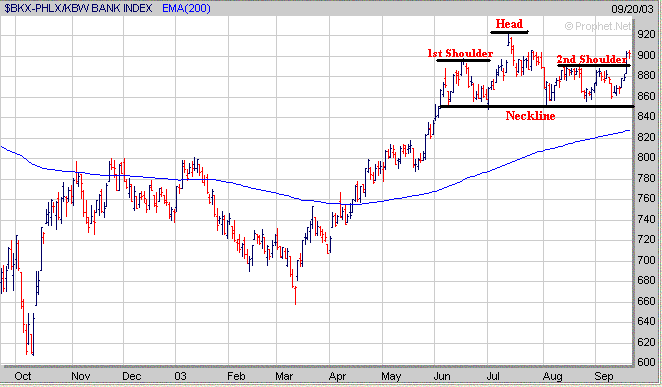
In addition one key sector to watch that has quite a bit of
influence on the S&P 500 are the Banks (BKX). This past week the BKX
performed well which may have negated the potentially bearish looking Head and
Shoulders Top pattern as the BKX did break above its 2nd Shoulder. If the
BKX continues higher next week I would imagine it will encounter some resistance
as it approaches the 920 level.
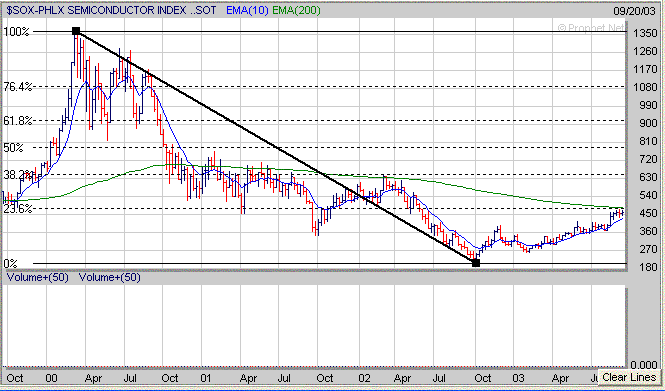
Meanwhile continue to watch the Semiconductors (SOX) closely as
right now they have encountered resistance near the 475 level which coincides
with their 200 Weekly EMA (green line) and longer term 23.6% Retracement
(calculated from the early 2000 high to the October 2002 low). If the SOX
breaks strongly above the 475 level this could eventually lead to a significant
move up to its 38.2% Retracement Level near the 640 area in the longer
term. In the shorter term it will be important for the SOX to hold support
near its rising 10 Weekly EMA (blue line) which is currently around the 430
level.
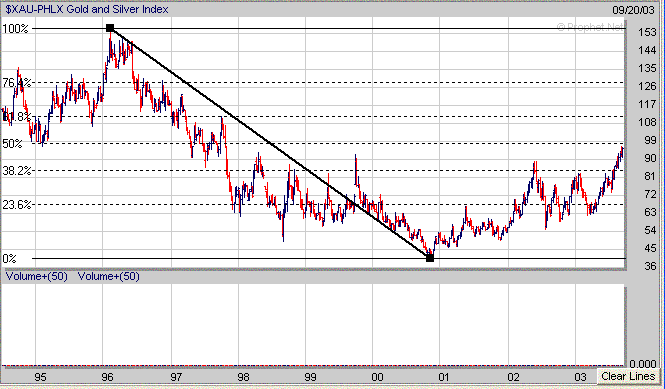
Finally some of you have asked me to comment on the Gold
sector. A longer term chart of the Gold and Silver sector (XAU) shows that
it is currently approaching its 50% Retracement Level (calculated from the 1996
high to the 2000 low) near 99. If the XAU can rally above the 99 area then
its next major area of upside resistance would be at its 61.8% Retracement Level
near 110.
Over time you will see a lot of stocks form the right side of a
Cup and then develop a Handle. Usually a Handle will develop as a stock
remains in a trading range for a period of time and will appear rather
flat. However sometimes explosive moves can occur as a stock develops a
Pennant for a Handle after moving up significantly over a short period of time.
In the example below notice how TTMI gapped up strongly for one
week and went from $6 to $9.50 (point B) as it formed the right side of a
Cup. Then over the next four weeks it developed a Pennant (point C) for a
Handle as the trading range narrowed considerably which is usually a precursor
to a significant move in one direction or the other. In this case TTMI
made an explosive move to the upside over the next three weeks and went
from $8 to nearly $14 for a gain of 75%.
Thus play close attention to those stocks which develop a
Pennant for a Handle as sometimes they can lead to substantial upward moves over
a short period of time.

Signup Today for a
"Free" Trial Membership and see which Stocks
are currently developing a favorable "Cup and Handle" pattern
Amateur-Investor.net
|


