|
Introductory
Special for New Members
Signup today and save 50% on our Membership Packages
which include our Stocks to Watch List and Daily Breakout Reports
Weekend Market Analysis
(9/27/03)
As I talked about last weekend the question was whether the
major averages would rally up to their longer term resistance levels (10000 Dow,
2050 Nasdaq and 1050-1065 S&P 500) before undergoing a corrective 4th Wave
in relation to Elliot Wave Theory.
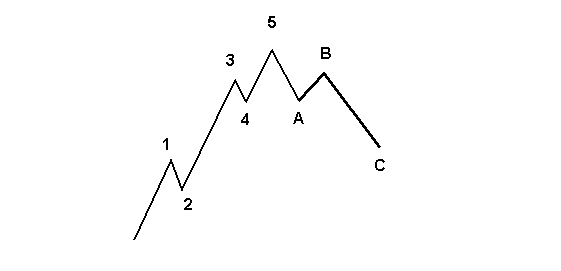
Once again a quick review for those of you not familiar with Elliot Wave
Theory and what a "5 Wave Pattern" looks like is shown below.
Notice how Waves 1,3 and 5 are upward moves with Wave 3
lasting the longest while Wave 5 is the shortest. Meanwhile also notice
that Waves 2 and 4 are corrective Waves which only last for a brief period of
time before the upward trend continues.
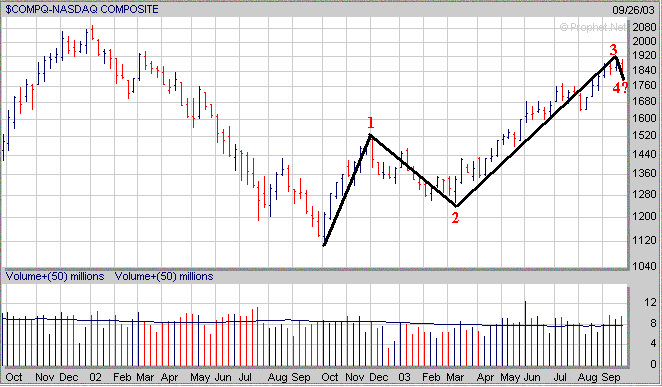
If we look at the current chart of the Nasdaq it appears a
similar pattern is evolving and we now may be seeing the development of the corrective
"4th Wave" before the final 5th Wave occurs.
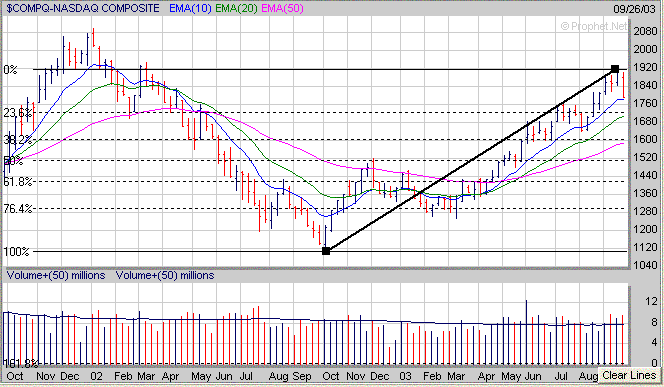
If a corrective 4th Wave continues to evolve then the question
is where will the major averages find support at? Looking at the Nasdaq
first on a weekly basis shows that it's right at its 10 Weekly EMA (blue
line). Also notice that since late March it has always found support near
its 10 Weekly EMA on any pullback while remaining in its up trend. If the
Nasdaq fails to hold support near its 10 Weekly EMA then the next area of
support appears to be in the 1700-1720 range which coincides with its
23.6% Retracement (calculated from the October 2002 low to the recent high) and
20 Weekly EMA (green line).
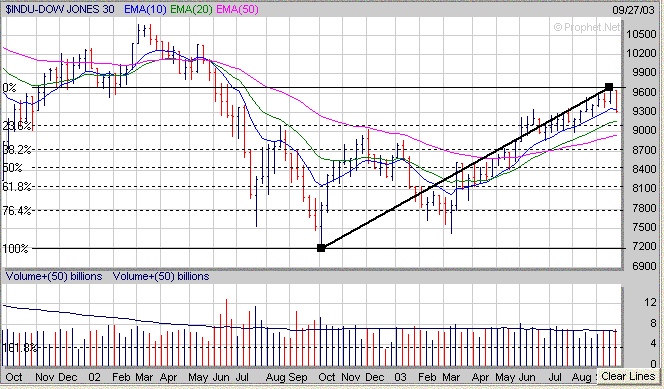
As for the Dow it closed just below its 10 Weekly EMA
(blue line) on Friday and the next support area appears to be in the 9075-9150
range which coincides with its 23.6% Retracement (calculated from the October
2002 low to the recent high) and 20 Weekly EMA (green line).
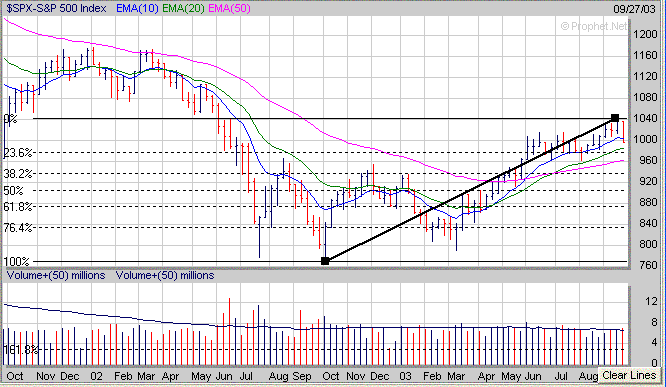
The S&P 500 also closed below its 10 Weekly EMA on Friday
and the next area of support is in the 975-985 range which coincides with its 20
Weekly EMA and 23.6% Retracement from the October 2002 low to the recent high.
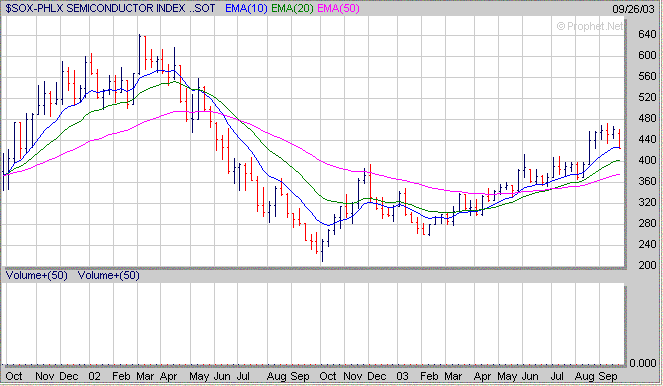
Meanwhile as far as some of the major sectors a weekly chart of
Semiconductor Index (SOX) shows that it's right at its 10 Weekly EMA (blue
line). If the SOX fails to hold support near this level then it will probably
drop back to its 20 Weekly EMA (green line) near 400.
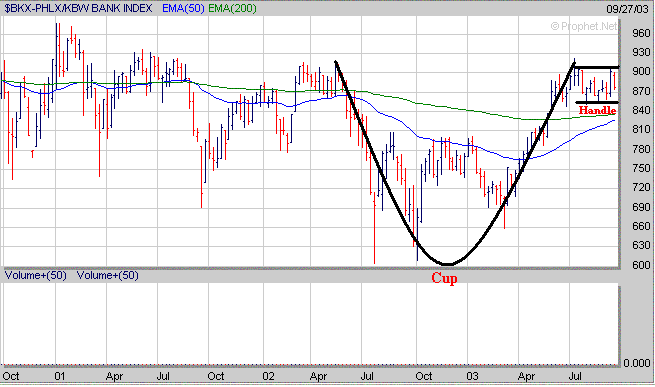
Meanwhile when looking at a weekly chart of the Banking Sector (BKX)
which is factored heavily in the S&P 500 it looks to me like it has been
developing a longer term Cup and Handle pattern. The key support area I
would watch in the BKX would be near 850 as that is where the bottom of the
Handle exists. If the 850 level doesn't hold then the developing Handle
would be violated.
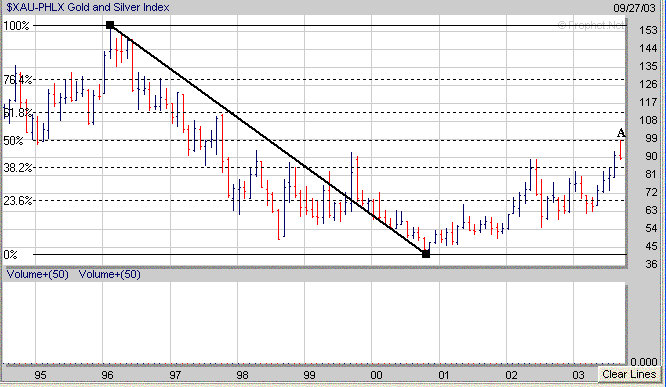
Meanwhile for those of you that don't think Retracement Levels
are important to watch look at where the Gold and Silver Index (XAU) ran into
trouble at last week. Right at the longer term 50% Retracement near 99
(point A) calculated from the 1996 high to the 2000 low.
Despite the market being in a corrective mode (possibly 4th Wave
as mentioned in the beginning) now is a good time to start keeping track of
those stocks which are holding up well versus those that aren't. Once the
correction is over with those stocks which have held up well may become the next
market leaders as the final 5th Wave develops.
Signup Today for a
"Free" Trial Membership and see which Stocks
are currently developing a favorable Chart Pattern
Amateur-Investor.net
|


