|
Weekend Stock Market Analysis
(4/15/06)
The price of Crude Oil which held support at its 200 day EMA
(green line) back in February and March has now rallied back to where it stalled
out twice before in the lower 70's (early February and last August). As we have seen in the past when the
price of Crude Oil has undergone a substantial move upward (points A to B) this
has usually led to some selling pressure in the Dow (points C to D).
Meanwhile as mentioned above since mid March the price of Crude Oil has been on the rise (points E
to F) and once again this has led to some selling pressure in the Dow (points G
to H). At this point there are two scenarios that may
occur with the price of Crude Oil over the next few weeks which may affect the
Dow. The first scenario would be for the price of Crude Oil to stall out
in the lower 70's and then pullback to its 50 Day EMA (blue line) which is
currently near the 66 level. If this occurs then this may have a positive
affect on the Dow over the next few weeks. Meanwhile the second scenario
would be for the price of Crude Oil not to stall out in the lower 70's and
continue to move higher in the weeks ahead. If this were to happen
then this would likely have a negative affect on the Dow. 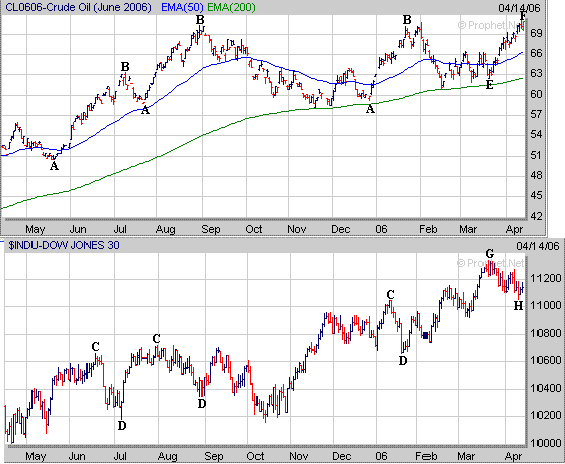
In the near term the Dow so far has
held support near its 50 Day EMA (blue line) and upward sloping trend line
(black line) that originates from the October 2005 low. As talked about
above if the price of Crude Oil were to stall out in the lower 70's and then
pullback to its 50 Day EMA near the 66 level then the Dow could begin to rally
and eventually rise back to its previous high made in mid March near 11350
(point I). However if the price of Crude Oil were to continue higher and
eventually rise into the upper 70's to around 80 then the Dow may break below its 50 Day
EMA and upward sloping trend line leading to an eventual drop back to its 200
Day EMA (green line) near 10800. 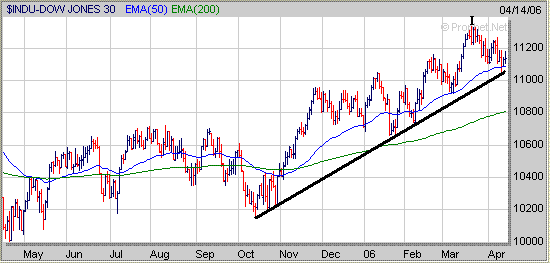
As far as the Nasdaq it broke out of
its 3 month trading range a few weeks ago however it wasn't able to follow
through and dropped back to its 50 Day EMA (blue line) near 2300 early in the
week. However on the positive side the Nasdaq did hold support at its 50
Day EMA on Wednesday and Thursday. 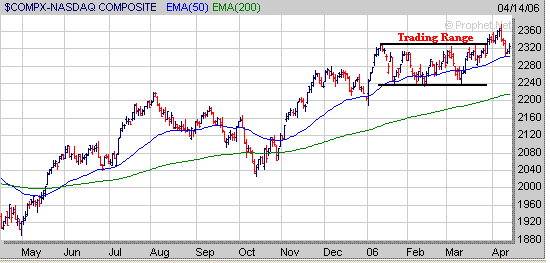
Keep in mind the once sector to
watch which may have an impact on the Nasdaq is the Semiconductors. The
Semiconductor Index (SOX) encountered strong resistance at the 560 level back in
January which coincided with where it had stalled out in January of 2004 (point
J). Meanwhile since early January the SOX has been in a pullback mode but
so far has been holding support at its 40 Weekly EMA (blue line). At this
time there appears to be two possible scenario's for the SOX in the longer
term. The first scenario would be for the SOX to eventually break above
the 560 level resistance area and make a substantial move higher which would
have a positive impact on the Nasdaq in the longer term. Meanwhile the
second scenario would be for the SOX to eventually break below its 40 Weekly EMA
leading to a significant downward move which would have a negative affect on the
Nasdaq in the longer term. 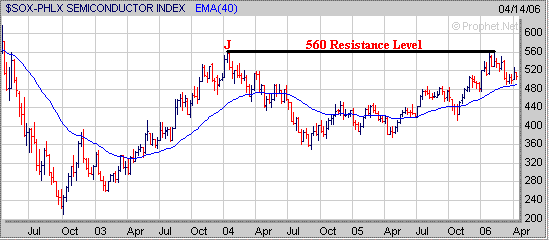
As far as the S&P 500 it broke
out of its 2 1/2 month trading range back in mid March but just like the Nasdaq
hasn't been able to follow through and briefly dropped below its 50 Day EMA
(blue line) this week. At this point the question is will the S&P 500
be able to hold support near its 50 Day EMA next week or not? If the
S&P 500 can hold support near its 50 Day EMA and then begins to rally it may
rise back to the high made just over a week ago near 1315. However if the
S&P 500 is unable to hold support near its 50 Day EMA then it may eventually
drop back to the 1255 area which coincides with the bottom of its previous
trading range (point K) and rising 200 Day EMA (green line). 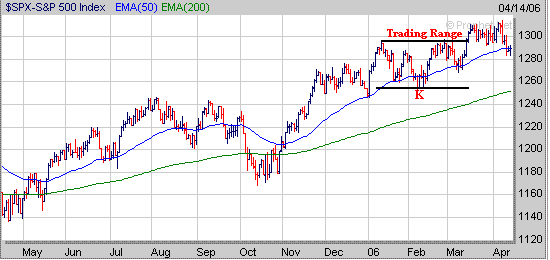
Finally no matter whether you are
new to investing or are very experienced at it focus on those stocks which are
breaking out of a favorable chart pattern such as the Cup and Handle, Double Bottom
or Flat Base. For example HSR had developed a 5 month Cup
followed by a 12 week Handle before breaking out this week accompanied by strong
volume. Remember the key is to find these type of chart pattern before
they breakout and not after. 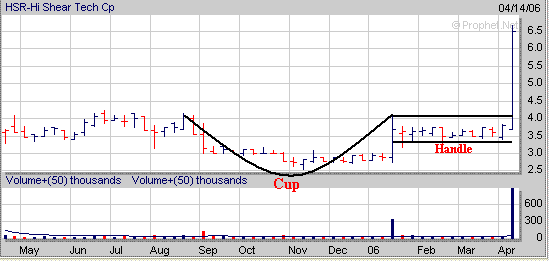
Meanwhile
a longer term chart of HSR shows that it has now completed the right side of 15
month Cup. Over the next several weeks I will be watching HSR closely to
see if it can develop a constructive Handle much like we saw in the chart above. 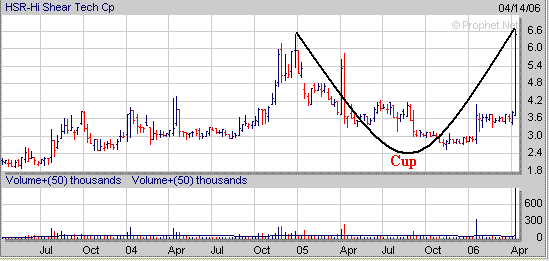
Signup today for a "Free"
2 Week Trial Membership to Amateur Investors and have access to
all of the Stocks in our current Stocks to Watch Buy List which contains stocks that are currently developing a favorable chart
pattern such as the Cup and Handle, Double Bottom and Flat Base which can be used with either our Long Term
Investing Strategy or Short Term Investing
Strategy.
Also you will have access to these other investment products.
Daily Breakout Reports
Market Timing Indicator
Daily ETF Buy and Short Signals
Click
Here to Signup for a "Free" 2 Week Trial Membership
Send this Free Newsletter to a Friend or Relative
Amateur Investors
|


