|
Click
Here to Signup for a Free 2 Week Trial Membership and
have access to our Stocks to Watch List and Daily Breakout Reports
Weekend Stock Market Analysis
(4/16/05)
The selling pressure increased this week and it's beginning to
look like a potential climax sell off as the Contrarian Indicators are showing a
lot of fear now entering the market. The Volatility Index (VIX) rose
substantially this week and we haven't seen an upward move like this since last
August as the S&P 500 was nearing a bottom (point B). 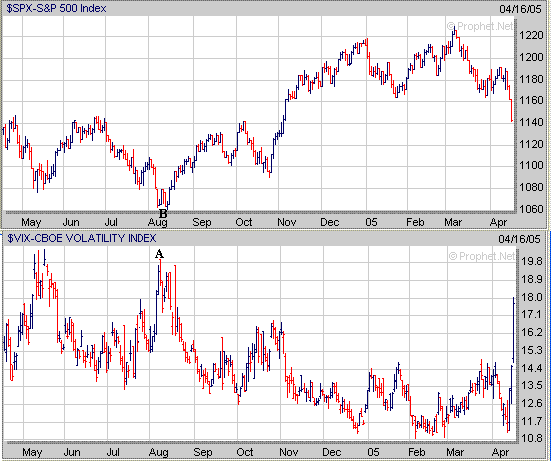
Meanwhile the 5 Day Average of the
Put to Call Ratio is now well above 1.0 (point C) and hasn't been this high
since May of 2004 (point D) as the S&P 500 made a bottom (point
E). 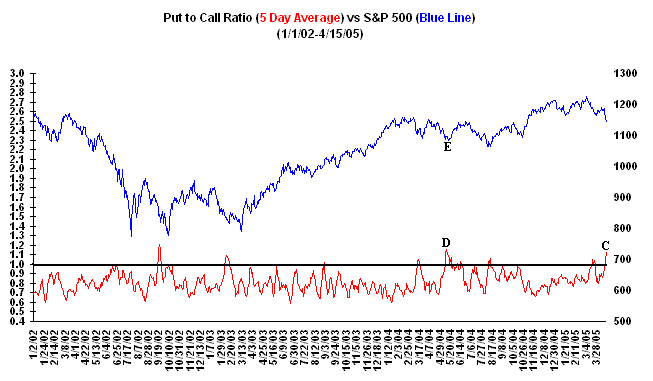
Meanwhile if we look at our Market
Timing Indicator (MTI) on a Weekly timeframe and apply it to the Dow the %K Line
in association with the Slow Stochastics has now dropped well below 20 (point
F). In the past when the %K Line has dropped to 20 or below (points G) on
a Weekly timeframe this has usually been a fairly reliable signal that a bottom
is nearing and that an oversold rally will develop (points H to I). 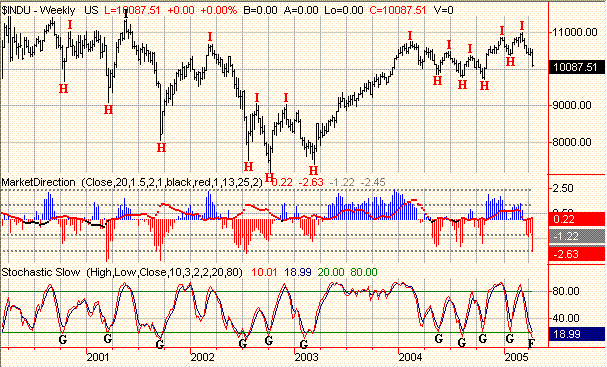
Although it appears the market is
unraveling the Contrarian Indicators and our MTI suggest that a bottom may occur
before much longer followed by a multi week oversold rally. As
far as the major averages the Dow failed to hold support last week at its 50%
Retracement Level near 10350 (calculated from the October 2004 low to the early
March high) and has dropped below its 61.8% Retracement Level at 10200. I
expect the Dow will find support either at its 76.4% Retracement Level near
10000 (point J) or at its October 2004 low near 9700 (point K) which will lead
to an eventual oversold rally. 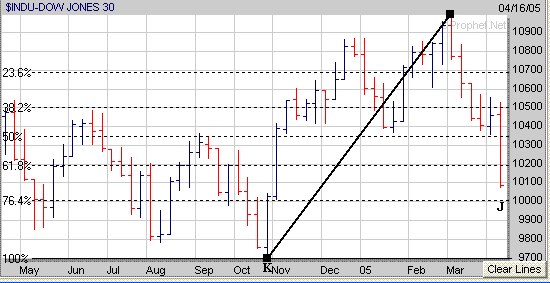
The Nasdaq failed to hold support
this week at its 50% Retracement Level near 1970 (calculated from the August
2004 low to the early January high) and has broken below its 61.8% Retracement
Level near 1920. There appear to be two possible areas where an oversold
rally may develop in the Nasdaq. The first would be around 1900 which is
where the Nasdaq found support last October (point L) and the second would be at
its 76.4% Retracement Level near 1855 (point M). 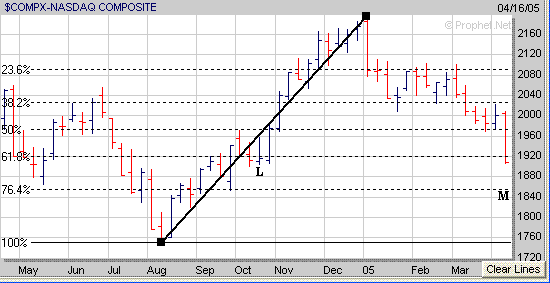
As far as the S&P 500 it failed
to hold support at its 38.2% Retracement Level near 1163 (calculated from the
August 2004 low to the early March high) and has dropped back to its 50%
Retracement Level near 1143. If the S&P 500 doesn't undergo an
oversold raly near the 1143 area and continues lower I would look for an
oversold rally to develop at its 61.8% Retracement Level near 1125 (point
N). 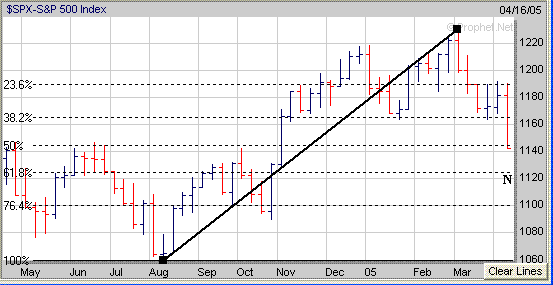
I know at this point it looks like
the major averages are in big trouble however based on the amount of fear shown
by the Contrarian Indicators and the signals coming from our Market Timing
Indicator don't be surprised if an oversold rally develops before much longer. Meanwhile
when the market is selling off you should be paying close attention to those
stocks which are holding up well as they may perform the best once the market
makes a bottom and begins to rally from oversold conditions. For example
DNA has just completed the right side of a 1 year Cup and now needs to develop a
constructive Handle. 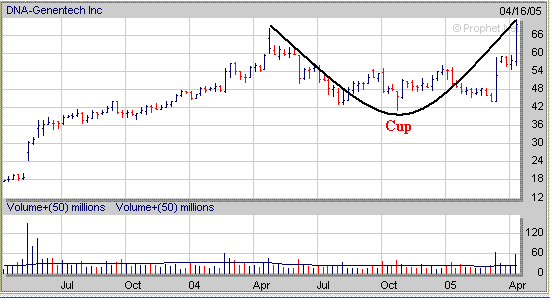 Signup today for a "Free"
2 Week Trial Membership and have access to our Stocks
to Watch List which provides a list of Stocks that are exhibiting a
favorable Chart Pattern such as the "Cup and Handle", "Double
Bottom" and "Flat Base". Also you
will receive our Daily Breakout Report
by email which Alerts you to Stocks that
are breaking out of a favorable Chart Pattern from our Stocks
to Watch List.
Click
Here to signup for a "Free" 2 Week Trial Membership
Amateur-Investor.net
|


