|
Signup
today and save 50% on a Premium Membership Plan
which includes our Stocks to Watch List and Daily Breakout Reports
Weekend Stock Market Analysis
(4/17/04)
Looking at the major averages from a longer term perspective the
Dow has been holding support above its 23.6% Retracement Level (calculated from
the October 2002 low to the February 2004 high) and 40 Weekly EMA (blue line)
after peaking in February near 10750 while undergoing a corrective 4th
Wave. It still not clear whether the low made in late March was the
beginning of the final upward moving 5th Wave in association with Elliot Wave
Theory or whether it was just an oversold bounce. One thing is for
sure the 9900 to 10000 range is a key longer term support area for the
Dow. If the Dow breaks below 9900 this would likely lead to a drop back to
its longer term 38.2% Retracement Level near 9400 (point A). 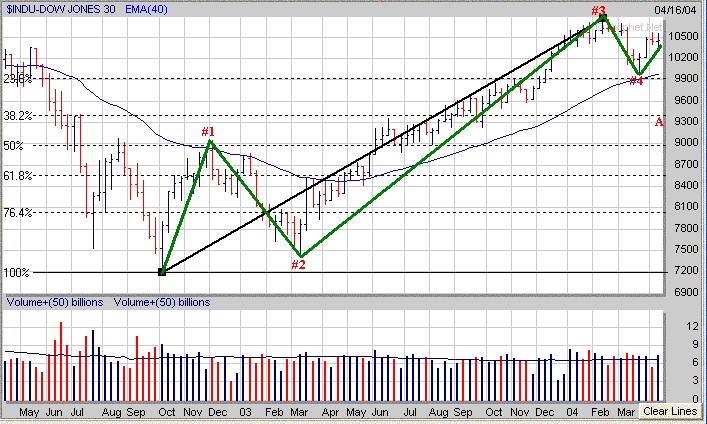
The Nasdaq found support in late March near its 23.6%
Retracement Level (calculated from the October 2002 low to the January 2004
high) and 40 Weekly EMA (blue line) near 1890 while undergoing a corrective 4th
Wave. Just like the Dow the question is was the low made in late March the
end of the corrective 4th Wave and the beginning of the final upward moving 5th
Wave or was it just an oversold bounce? Meanwhile the Nasdaq has a key
longer term support area near 1890 which will need to hold for the Nasdaq to be
constructive. If the Nasdaq breaks below 1890 the next downside support
area would be at its 38.2% Retracement level near 1750 (point B). 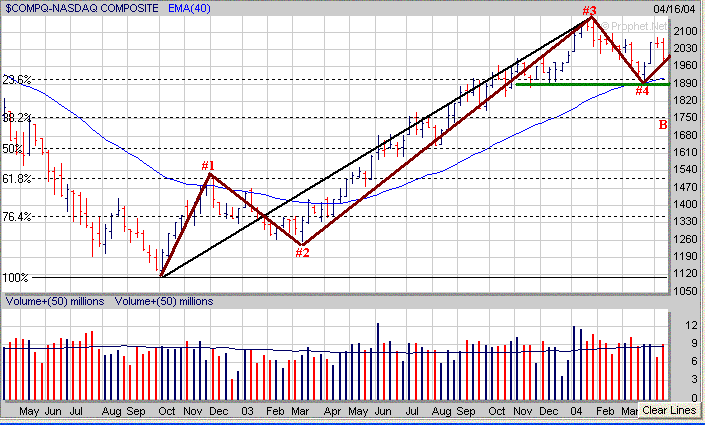
As far as the S&P 500 it has held support above its
longer term 23.6% Retracement Level and 40 Weekly EMA (blue line) since peaking
in early March and undergoing a corrective 4th Wave. As with the Dow and
Nasdaq the question remains was the low made in late March the end of the
corrective 4th Wave and beginning of the final upward moving 5th Wave or was it
just an oversold bounce? Although the S&P 500 found support in late
March near 1090 I believe the key longer term support level to watch in the
weeks ahead is in the 1075-1080 area (point C) which coincides with the S&P
500's 23.6% Retracement Level and 40 Weekly EMA (blue line). 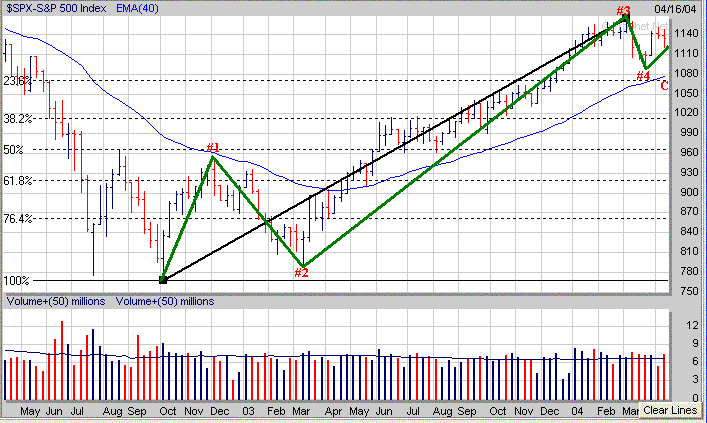
Meanwhile looking at a few sectors the Semiconductor Holders
(SMH) may have already completed their Elliot 5 Wave pattern and are now
undergoing a longer term correction. A key support level to watch in the
near term is around 37 (point D). If the SMH's break below 37 then the
next area of downside support would be near 35 which is their 38.2% Retracement
Level calculated from the October 2002 low to the January 2004 high. 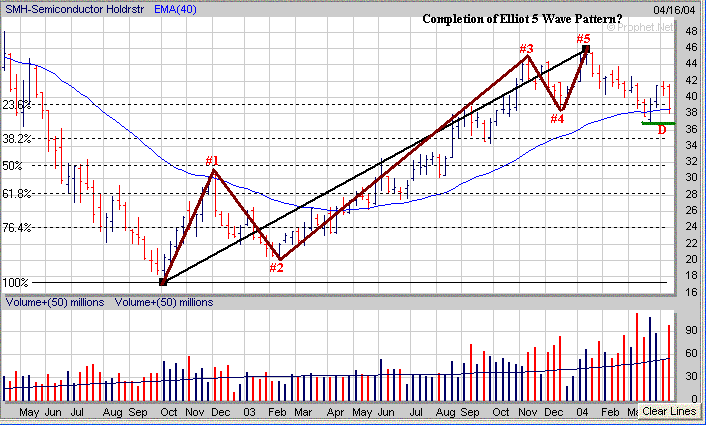
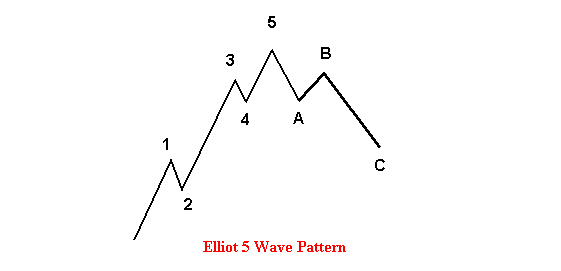
A simplified chart of an Elliot 5 Wave Pattern is shown
below. Notice how Waves 1,3 and 5 are upward moves with Wave 3 lasting
the longest while Wave 5 is the shortest. Meanwhile also
notice that Waves 2 and 4 are corrective Waves which only last for a brief
period of time before the upward trend continues. Also notice that
once the 5 Wave pattern completes itself that this is followed by a longer term
correction.
Meanwhile the Banking sector (BKX) which is heavily weighted in
the S&P 500 is showing a Head and Shoulders Top pattern. The BKX broke
below a key support level last week near 98 which coincided with its Neckline
and 100 Day EMA (green line). The key thing to watch next week is will the
BKX break above the 98 level and rally back to its 50 Day EMA (blue line) just
above 99 or will it stall out near 98 leading to a potential drop back to its
200 Day EMA (purple line) near 94? 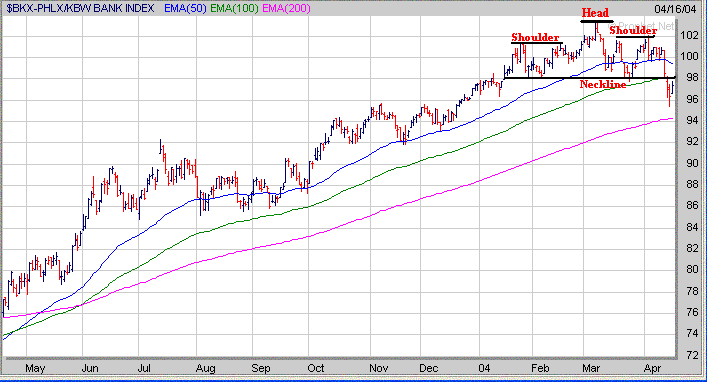
As far as the major averages in the near term the Dow has
resistance around 10575 (point E) so if it tries to rally next week this is
where it could stall out at. Meanwhile if the Dow comes under some selling
pressure look for initial support at its 100 Day EMA (green line) around
10275. A break below 10275 would likely lead to a retest of the late March
low near 10000 (point F). 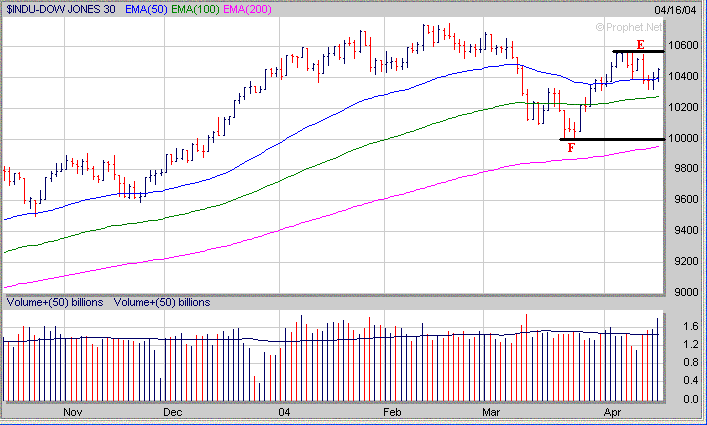
The Nasdaq is near its 100 Day EMA (green line) and has
upside resistance around 2080 (point G) while a key support level exists in the
1890-1900 area which coincides with its late March low (point H) and 200 Day EMA
(purple line). I would be surprised if the Nasdaq just nosedives
down to the 1890-1900 level without first going through some type of possible
bounce as it's becoming somewhat oversold based on the Slow Stochastics.
Notice that in most cases when the %K Line has dropped to 20 or below (points I)
this has signaled the potential for an upside reversal except in mid March when
the Nasdaq only rallied for a day (point J). 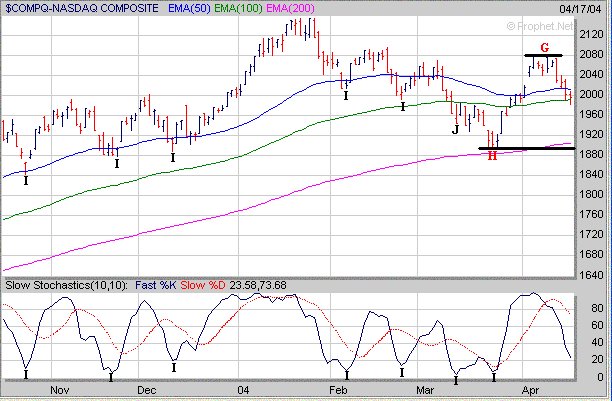
As far as the S&P 500 if it rallies next week look for
upside resistance around 1050 (point K). Meanwhile if the S&P 500
drops below 1120 look for initial support at its 100 Day EMA (green line) near
1110. 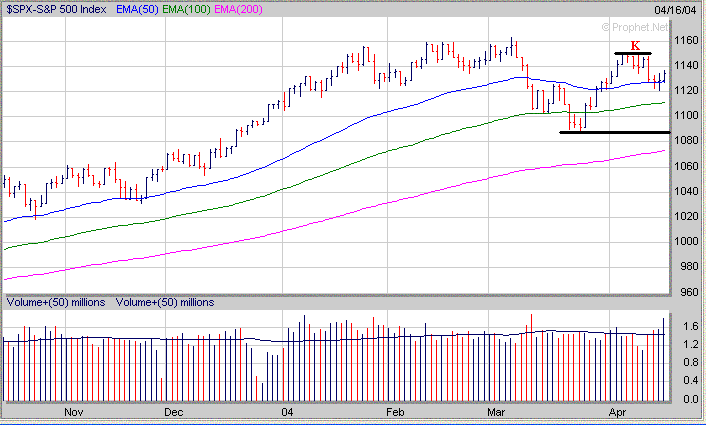
Finally even though a majority of stocks will follow the
trend of the market noticing those that are acting well while the market is
correcting can still lead to substantial gains. TASR is an excellent
example of this as it continues to surge higher. When looking at the
overall chart of TASR during the past 2 years shows that it initially broke out
of a Cup and Handle (H) pattern in September of 2003 and then went from $8 to $31 by
December of 2003. Those investors who missed the initial breakout in TASR
were given a second opportunity as it then developed a small 5 week Flat Base (FB)
before breaking out again in Janaury of 2004 accompanied by strong volume
(V). Over the next 5 weeks TASR doubled in price going from $31 to
$64. Meanwhile those investors who missed the original breakout and second
breakout were given a third opportunity as TASR developed a small Symmetrical
Triangle (ST) in February of 2004 before breaking out again in mid March
accompanied by strong volume (V). Over the past 6 weeks TASR has
nearly doubled in price once again. The chart of TASR shows three
chart patterns to look for (Cup and Handle, Flat Base and Symmetrical
Triangle) when screening for stocks to invest in. The key
is to recognize those chart patterns before a stock breaks out and not
afterwards. 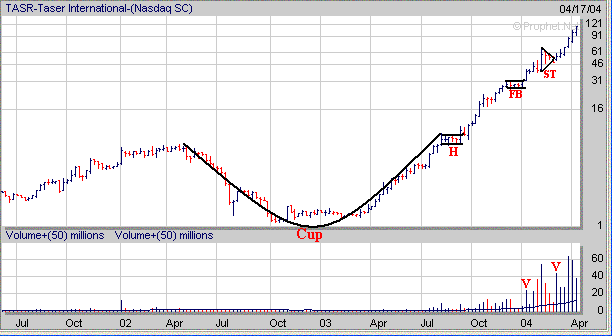
How can a Premium Membership to amateur-investor.net
benefit you as an investor? We focus on stocks which are exhibiting
favorable Sales and Earnings Growth that have developed a favorable chart pattern such as a
"Cup and Handle",
"Double Bottom", "Flat Base" or "Symmetrical
Triangle". These stocks are then
included in our "Stocks to Watch List" which gives investors a
quick reference to those stocks which may provide the best buying opportunities
to the long side in the weeks ahead. Each stock in
our "Stocks to Watch List"
includes specific Buy Prices, Stop Loss Prices (very important) and projected
Target Prices. Signup
Today for a "Free" Trial Membership
and see which Stocks to Buy or Short in the weeks ahead
Amateur-Investor.net
|

