|
Weekend Stock Market Analysis
(4/22/06)
Despite the continued rise in the price of Crude Oil the major
averages rallied this week although most of the gains occurred on Tuesday.
A longer term chart of the price of Crude Oil shows that it has been holding
support at its 40 Weekly EMA (blue line) since the late part of 2003 while
remaining in an up trend. Meanwhile this week the price of Crude Oil rose
above a significant resistance area near 70 and it looks like this could lead to
a move up to the 80 level at some point. As we have seen in the past when
the price of Crude Oil has made a significant move higher (points A to B) this
has generally had an adverse affect on the Dow (points C to D). Thus if we
see another extended period of higher Crude Oil Prices with the price of Crude
Oil eventually rising into the 80's this would likely have a
negative affect on the Dow. 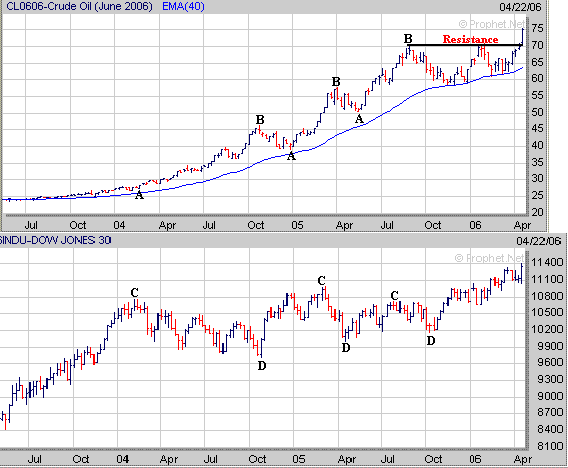
Meanwhile if we look at a longer
term chart of the Dow it has now risen back to a longer term resistance area
near 11400 which is where it has stalled out at three separate times in 2000 and
2001 (points E). Now the question is will the Dow stall out near the 11400
and then go through a correction or will it rise above the 11400 leading to a
move up to its all time high near 11750 (point F) made in early 2000? As
mentioned above further action in the Dow will likely depend on what happens
with the price of Crude Oil in the weeks ahead. 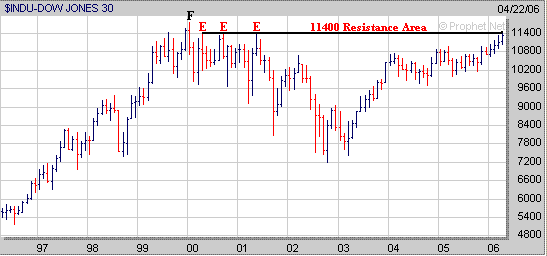
In the shorter term if the Dow does
stall out near the 11400 area and begins to pullback look for initial support at
its 20 Day EMA (blue line) near 11200 or at its 50 Day EMA (green line) just
above 11100. 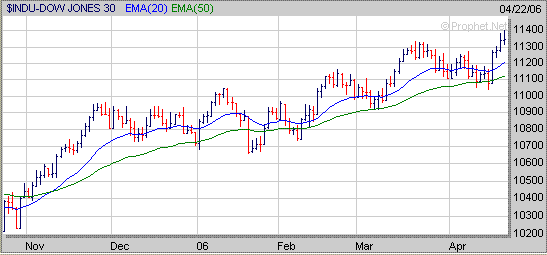
As far as the Nasdaq it encountered resistance on Thursday near its previous
high made earlier in the month near 2375 (point G) and then sold off on Friday
which led to a drop back to its 20 Day EMA (blue line) near 2335.
In the short term if the Nasdaq breaks below its 20 Day EMA then its next area
of support would either be at its 50 Day EMA (green line) near 2310 or the low
made just over a week ago around 2300 (point H). 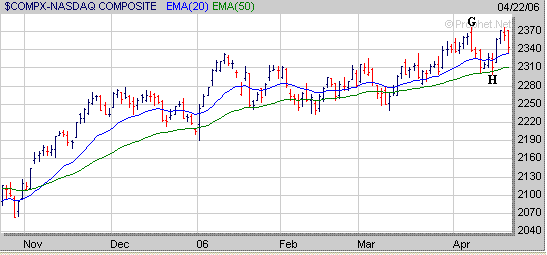
In the longer term on a logarithmic
scale the Nasdaq appears to have a potential upside resistance area near 2400
which corresponds to its 50% Retracement Level (calculated from the early 2000
high to the late 2002 low). 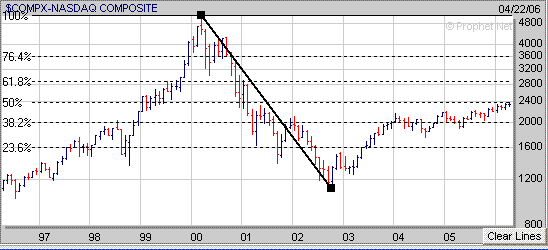
However
if we look at a standard linear chart instead you can see this potential upside
resistance area doesn't show up. Thus it will be interesting to see
if the Nasdaq will be able to break above the 2400 level in the weeks ahead or
not. 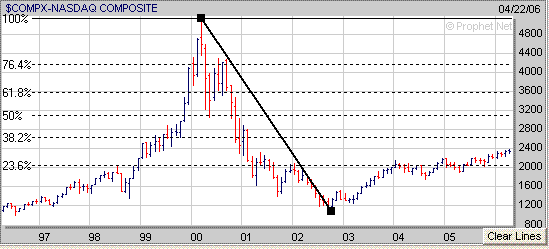
The
S&P 500 rallied this week and made a new 52 week high on Thursday but then
reversed somewhat on Friday. In the short term look for initial support at
its 20 Day EMA (blue line) near 1300 if it pulls back some. If the S&P 500 were to drop below its 20 Day
EMA then its next level of support would be at its 50 Day EMA (green line) just
above 1290. 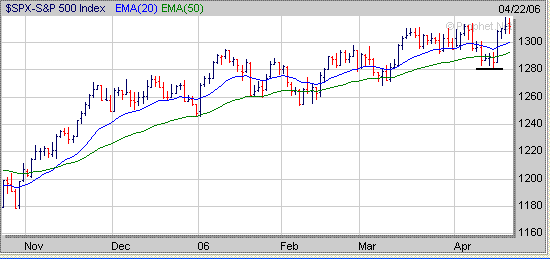
Meanwhile
if we look at a longer term chart of the S&P 500 it generally has been in a
choppy up trend since late 2002. If this trend continues then it appears the next
major upside resistance area would be around the 1360 level which is at the
S&P 500's 76.4% Retracement Level. 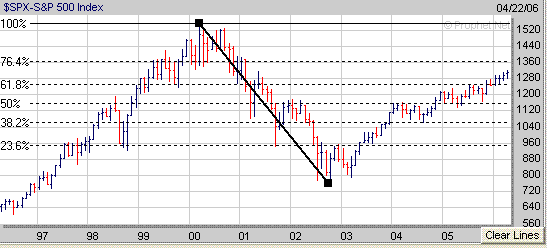
No
matter what happens to the market in the weeks ahead continue to keep a list of
those stocks which are developing a favorable chart pattern. For example Alcoa
(AA) from our Top 100 Stocks List has formed the right of a 2 year Cup and now
needs to work on developing a Handle over the next few weeks to complete a
"Cup and Handle" pattern. 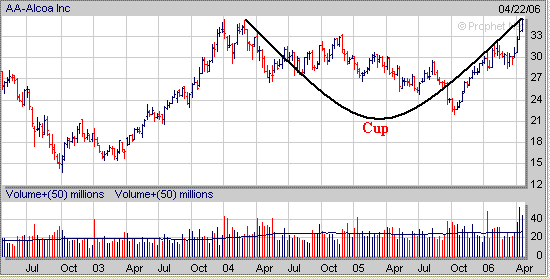
Signup today for a "Free"
2 Week Trial Membership to Amateur Investors and have access to
all of the Stocks in our current Stocks to Watch Buy List which contains stocks that are currently developing a favorable chart
pattern such as the Cup and Handle, Double Bottom and Flat Base which can be used with either our Long Term
Investing Strategy or Short Term Investing
Strategy.
Also you will have access to these other investment products.
Daily Breakout Reports
Market Timing Indicator
Daily ETF Buy and Short Signals
Click
Here to Signup for a "Free" 2 Week Trial Membership
Send this Free Newsletter to a Friend or Relative
Amateur Investors
|


