|
Click
Here to Signup for a Free 2 Week Trial Membership and
have access to our Stocks to Watch List and Daily Breakout Reports
Weekend Stock Market Analysis
(4/23/05)
The last three trading days of the week were very volatile to
say the least as a 30 minute daily chart of the Nasdaq is shown below. The
Nasdaq was down around 30 points on Wednesday, then rallied 50 points on
Thursday, which was then followed by a 30 point drop on Friday. On a
very short term basis it appears the Nasdaq needs to hold support around 1920
which is along its newly developed upward sloping trend line (black line) from
the Monday low. 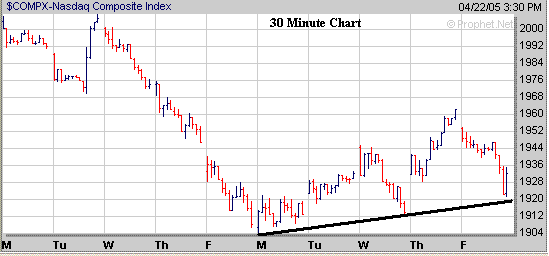
On a larger timeframe if the Nasdaq
fails to hold support near 1900 then its next major support level would come
into play around 1855 (point A) which corresponds to its 76.4% Retracement Level
(calculated from the August low to the early January high). Meanwhile if
the Nasdaq continues its choppy oversold bounce higher look for upside
resistance at its 50% Retracement Level near 1970 or around 2000 which
corresponds to its 50 Day and 200 Day EMA's 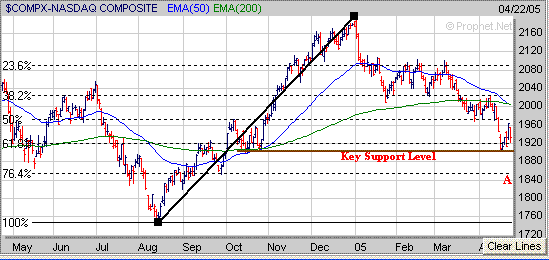
The Dow which found support at its
76.4% Retracement Level near 10000 (calculated from the October low to the early
March high) has encountered some resistance at its 61.8% Retracement Level near
10200. If the Dow can break solidly above 10200 then its next level of
upside resistance would be in the 10350 (50% Retracement Level) to 10420 (200
Day EMA) range. Meanwhile if the Dow fails to hold support around 10000
and eventually continues lower then its next area of support would be at the
August low near 9700 (point B). 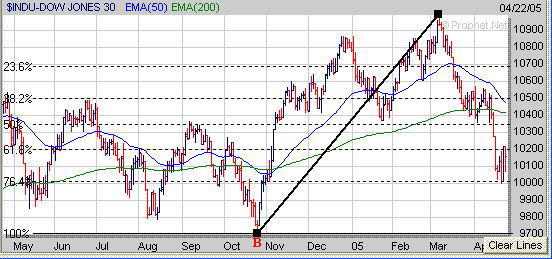
The S&P 500 has been trying to
hold support near 1140 (point C) but encountered resistance on Friday at its 200
Day EMA (green line) near 1160. If the S&P 500 can break above its 200
Day EMA and 38.2% Retracement Level near 1163 (calculated from the August low to
the early March high) then its next area of upside resistance would be at its 50
Day EMA (blue line) near 1180. Meanwhile if the S&P 500 breaks below
1140 then its next support area would be at its 61.8% Retracement Level near
1125 (point D). 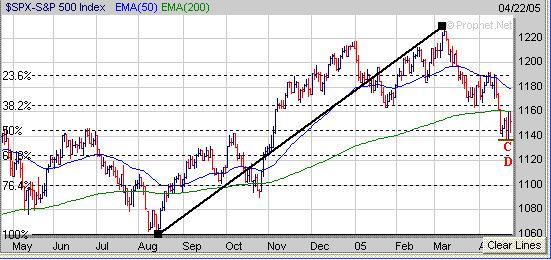
This week I thought I would focus on
the Bullish-Bearish Indicator which tracks the % of Investment Advisors that are
either Bullish or Bearish about the future prospects of the market. In the
past when the % of Bearish Advisors has become greater than the % of Bullish
Advisors this has usually signaled a bottom is nearing. In the chart below
when the % of Bearish Advisors has become much greater than the % of Bullish
Advisors the solid red line drops well below zero (points E). As you can
see since 1997 it has been a rare occurrence when the % of Bearish Advisors
exceeds the % of Bullish Advisors. However when it does occur this has
been followed by a substantial rally in the market (points F to G). The
last time the % of Bearish Advisors was far greater than the % of Bullish
Advisors was in the Fall of 2002 which was then followed by a long term rally
(points H to I) that continued into the early part of 2004. Right
now the % difference between the Bullish Advisors and Bearish Advisors is around
20% and favors the Bullish Advisors although the gap between the two has been
decreasing since the early part of the year. 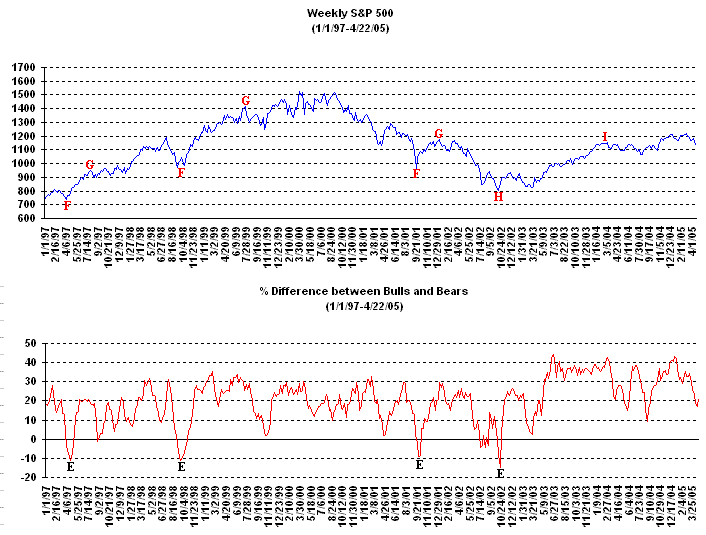
Signup today for a "Free"
2 Week Trial Membership and have access to our Stocks
to Watch List which provides a list of Stocks that are exhibiting a
favorable Chart Pattern such as the "Cup and Handle", "Double
Bottom" and "Flat Base". Also you
will receive our Daily Breakout Report
by email which Alerts you to Stocks that
are breaking out of a favorable Chart Pattern from our Stocks
to Watch List.
Amateur Investors Performance versus the Major Averages
(1/1/05-4/22/05)
Amateur Investors: +12.6%
Dow:
-5.8%
Nasdaq:
-11.2%
S&P
500:
-4.9%
Click
Here to signup for a "Free" 2 Week Trial Membership
Amateur-Investor.net
|


