|
Signup
today and save 50% on a Premium Membership Plan
which includes our Stocks to Watch List and Daily Breakout Reports
Weekend Stock Market Analysis
(4/24/04)
The major averages looked like they were in trouble early in the
week as it appeared they were going to test their late March lows. However
on Wednesday they quickly reversed to the upside. The Dow found support on
Wednesday near its 100 Day EMA (green line) around 10275 and then rallied back
above its 50 Day EMA (blue line). If the Dow continues to rally next week
I would expect resistance near the early April high just below 10600 (point
A). Meanwhile if the Dow stalls out and drops back below its 50 Day EMA
near 10400 look for support in the near term at its 100 Day EMA near 10275. In
the longer term if the Dow drops below 10275 then expect a retest of its late
March low (point B) and 200 Day EMA (purple line) near 10000. Meanwhile if
the Dow can clear the 10600 resistance area then look for it to rally back up to
its February high near 10750. 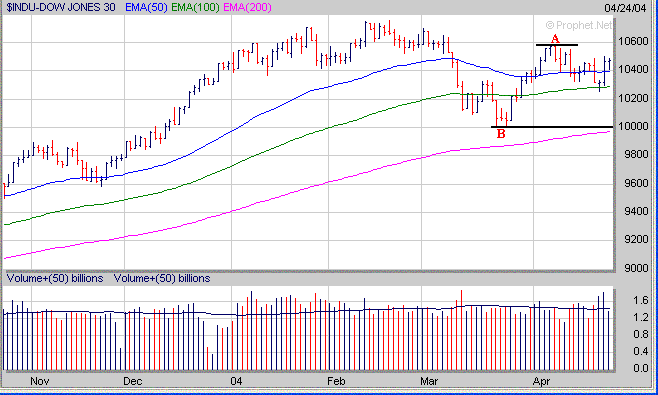
The Nasdaq found support near 1980
on Wednesday and has rallied back above its 50 Day EMA. In the near term
if the Nasdaq continues to rally next week look for resistance at its early
April high near 2080 (point C). Meanwhile if the Nasdaq stalls out
and pulls back some look for initial support at its 50 Day EMA near 2015. In
the longer term if the Nasdaq can break above the 2080 resistance area then this
could lead to a rally back to its January high near 2150. Meanwhile if the
Nasdaq drops below this past Wednesday's low near 1980 (point D) then this would
likely lead to a retest of its late March low (point E) or 200 Day EMA (purple
line) in the 1890-1910 range. 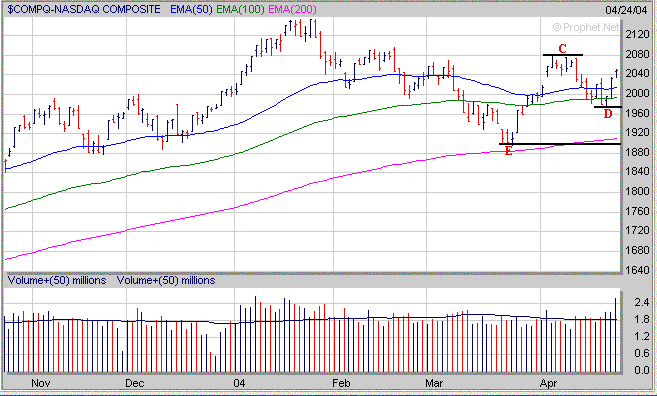
The S&P 500 held support last
week just above its 100 Day EMA (green line) and also rallied back above its 50
Day EMA (blue line). If the S&P 500 tries to rally next week look for
possible resistance at its early April high near 1050 (point F). Meanwhile
if the S&P 500 stalls out and begins to pullback look for initial support at
its 50 Day EMA just below 1030 or at its 100 Day EMA near 1015. In
the longer term if the S&P 500 can break above 1150 then it should rally
back to its early March high near 1063. Meanwhile if the S&P 500 drops
below its 100 Day EMA near 1015 then look for a retest of its late March low
near 1090 (point (G). 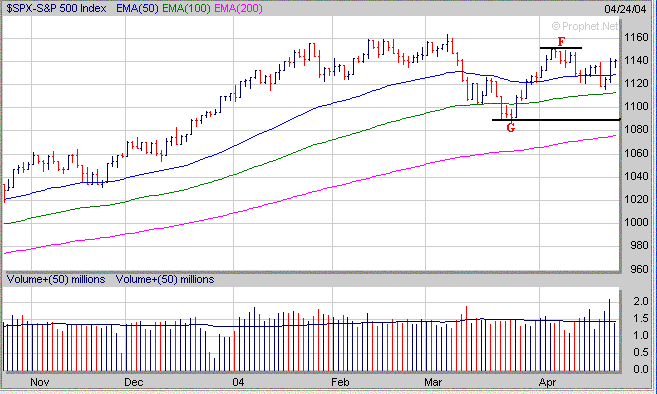
As far as some sectors the Banking
sector (BKX) is still showing a Head and Shoulders Top pattern and so far has
been unable to rally above the 98 level which coincides with its Neckline and
100 Day EMA (green line). If the BKX is unable to break above 98 a
key support area to watch in the near term is at its 200 Day EMA (purple line)
just above 94. Remember the BKX is heavily weighted in the S&P 500 so
the charts of the two pretty much mirror each other. 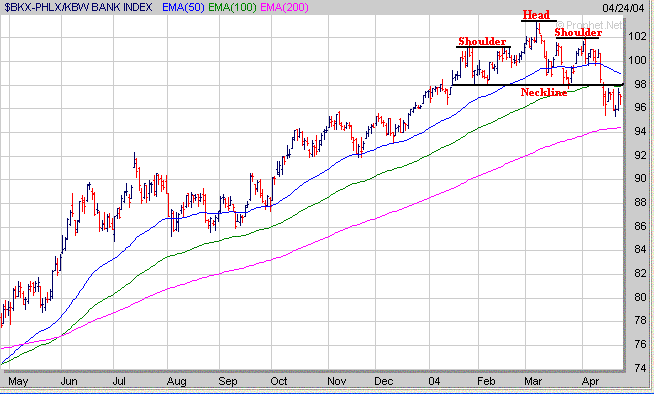
Looking
at the Semiconductor sector shows that the Semiconductor Holders (SMH) dropped
below their 200 Day EMA last week but did hold support just above their late
March low near 37 (point H). If the SMH's try to rally in the near term
look for resistance around the 40 level which coincides with their 50 Day and
100 Day EMA's. Meanwhile if the SMH's fail to hold support near
their late March low around 37 that would spell trouble for the longer term not
only for the SMH's but the technology sector in general. 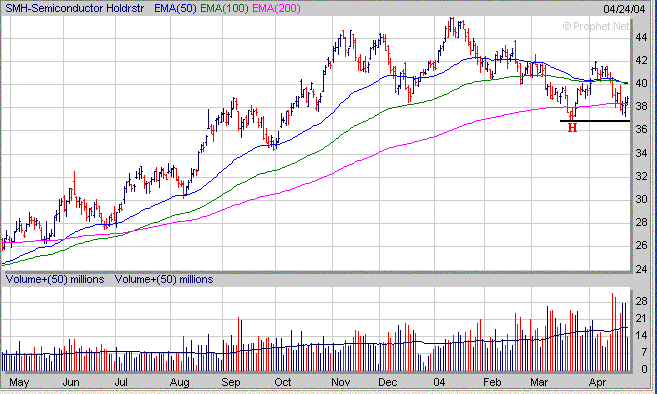
Finally when looking for stocks to
consider as a possible investment look for those that have developed a favorable
chart pattern and have a high Relative Strength (RS) that reside in a strong
performing Industry Group. ALDN has performed very well over the past 4
months as it's RS has been in the upper 90's while being in an Industry Group
which has had a high RS (currently 97) as well. Notice in 2003 ALDN began
to show an increase in Earnings Growth (solid blue lines) which has continued
through the early part of 2004. 
Meanwhile
the chart of ALDN shows that it formed a Cup from October of 2000 through
October of 2003. After forming a 3 Year Cup ALDN then developed an 11 week
Handle before breaking out in early January of 2004. Since breaking out in
January ALDN has gone up around 150%. We mentioned ALDN as a Stock to
Watch in December as it was developing its Handle in our Weekend
Report for 12/20/03. 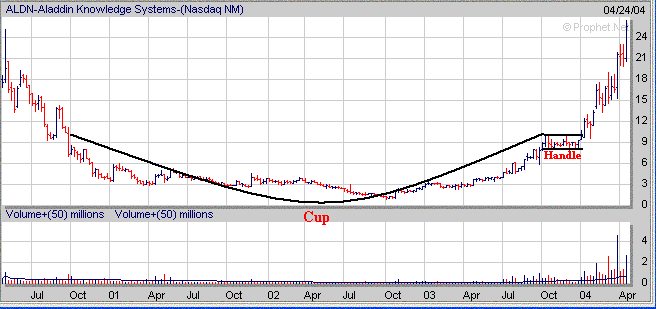
How can a Premium Membership to amateur-investor.net
benefit you as an investor? We focus on stocks which are exhibiting
favorable Sales and Earnings Growth that have developed a favorable chart pattern such as a
"Cup and Handle",
"Double Bottom", "Flat Base" or "Symmetrical
Triangle". These stocks are then
included in our "Stocks to Watch List" which gives investors a
quick reference to those stocks which may provide the best buying opportunities
to the long side in the weeks ahead. Each stock in
our "Stocks to Watch List"
includes specific Buy Prices, Stop Loss Prices (very important) and projected
Target Prices. Signup
Today for a "Free" Trial Membership
and see which Stocks to Buy or Short in the weeks ahead
Amateur-Investor.net
|


