|
Click
Here to Signup for a Free 2 Week Trial Membership and
have access to our Stocks to Watch List and Daily Breakout Reports
Weekend Stock Market Analysis
(4/2/05)
A brief oversold bounce occurred in the middle part of the week
however the major averages came under more selling pressure on Friday which
pretty much wiped out all of the gains that occurred on Wednesday. All
three major averages are back near key support levels and this coming week will
be interesting to watch. The Dow encountered upside resistance
this past week at its 20 Weekly EMA (green line) near 10570 as it attempted to
bounce from oversold conditions. The Dow has a key support level at 10350
(brown line) which corresponds to its 50% Retracement Level (calculated from the
October 2004 low to the early March high). If the Dow is unable to hold
support at 10350 then its next area of support would be at the 61.8% Retracement
Level around 10200 (point A). Meanwhile if the Dow does hold support at
10350 an attempts to rally once again look for upside resistance at its 20
Weekly EMA. 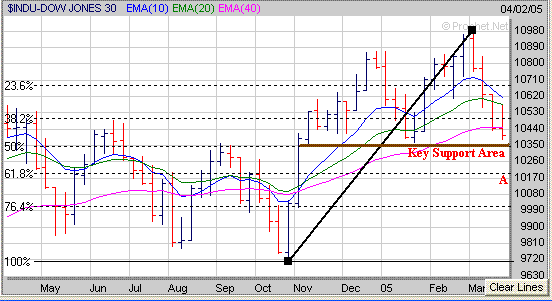
The Nasdaq which rallied strongly on Wednesday encountered
resistance at its 40 Weekly EMA (purple line) just above 2010. The Nasdaq
has a key support area around 1970 which corresponds to its 50% Retracement
Level (calculated from the August 2004 low to the early January high). If
the Nasdaq fails to hold support near 1970 then its next area of support would
be at its 61.8% Retracement Level near 1920 (point B). Meanwhile if the
Nasdaq can hold support at 1970 and attempts to rally once again look for
initial upside resistance at its 40 Weekly EMA near 2010. 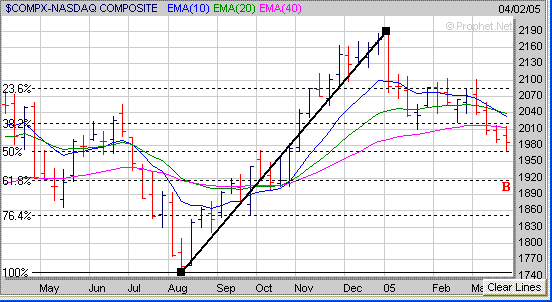
As far as the S&P 500 it also rallied strongly on
Wednesday but encountered resistance at its 10 Weekly EMA (blue line) near
1190. The S&P 500 has a key support area at its 40 Weekly EMA near
1160. If the S&P 500 fails to hold support near 1160 then its next
level of support would be around 1143 (point C) which corresponds to its 50%
Retracement Level (calculated from the August 2004 low to the early March
high). Meanwhile if the S&P 500 can hold support near 1160 and
attempts to rally once again look for initial upside resistance at its 10 Weekly
EMA near 1190. 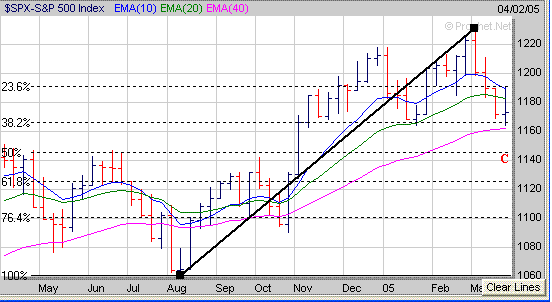
What may affect the market the most in the weeks ahead is the
price of Crude Oil which surged strongly on Friday. The price of Crude Oil
has had an impact on the market for over a year now. A plot of the price of Crude
Oil versus the Dow over the past year is shown below. As you can see when the price of Crude
Oil has surged higher (points D to E) the Dow has eventually come under selling
pressure (points F to G). If the price of Crude Oil continues
higher and rises into the 60's this will likely have a negative affect on the
major averages if the pattern we have seen over the past year
continues. On the other hand if the price of Crude Oil gets sold off
(points E to D) then this could lead to a rally (points G to F) in the major
averages like we have seen before as well. 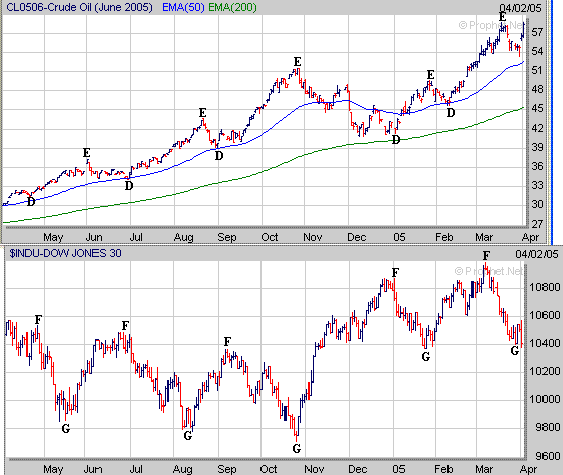 . .
Although the market has been very challenging so far in 2005
continue to keep a list of those stocks that are holding up well and developing
a favorable chart pattern which reside in strong sectors. For example GLBL
from our current Stocks to Watch List, which is in the Oil sector, has developed
a 5 week Handle (H) after forming the right side of a 2 year Cup. The
proper time to buy GLBL is once it clears its Pivot Point (P) which is at
$10.50. 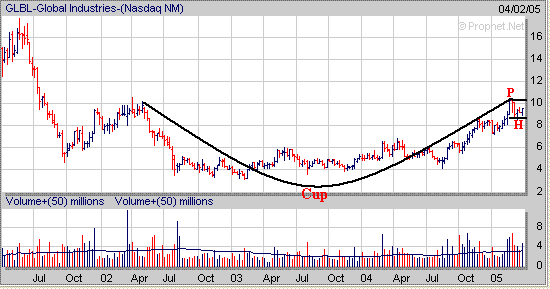
Signup today for a "Free"
2 Week Trial Membership and have access to our Stocks
to Watch List which provides a list of Stocks that are exhibiting a
favorable Chart Pattern such as the "Cup and Handle", "Double
Bottom" and "Flat Base". Also you
will receive our Daily Breakout Report
by email which Alerts you to Stocks that
are breaking out of a favorable Chart Pattern from our Stocks
to Watch List.
Click
Here to signup for a "Free" 2 Week Trial Membership
Amateur-Investor.net
|


