|
Click
Here to Signup for a Free 2 Week Trial Membership and
have access to our Stocks to Watch List and Daily Breakout Reports
Weekend Stock Market Analysis
(4/30/05)
It has been very volatile over the past two weeks on a daily
basis as the major averages have been all over the place. A 10 day 30
minute chart chart of the Dow is shown below with the amount of points it
traveled in each major up or down move. Friday was no exception as it made
a 140 point upward move from the early morning low near 10050 to the late
afternoon high around 10190. This type of action makes it a very difficult
trading environment no matter how much experience you have. 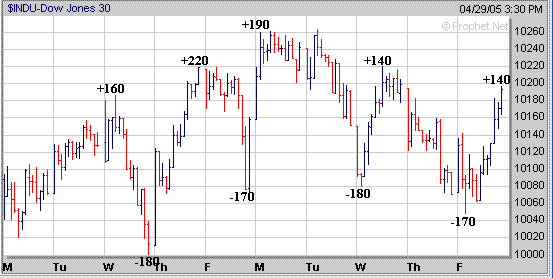
For those of you that read this column regularly know I have
talked about how the price of Crude Oil and the Dow have generally traded in
opposite directions of each other during the past year or so. On Friday
the price of Crude Oil broke through its 100 Day EMA (green line) near 51 and
possibly this had something to do with the Dow having a strong up day. If
the price of Crude Oil continues to fall look for the next area of support at
its 200 Day EMA (purple line) near 47. 
Meanwhile
a longer term weekly chart of Crude Oil shows that there is another important
support area near 45 which corresponds to its 38.2% Retracement Level
(calculated from the low in 2003 to the high made in early April) and upward
sloping trend line (solid brown line). If the price of Crude Oil fails to
hold support at its 200 Day EMA near 47 and drops below 45 then its next major longer term support level would be
around 41 which is at its 50% Retracement Level and also was near the low made in
late 2004 (point A). The question is if the price of
Crude Oil continues to fall will that eventually help to trigger a sustained
rally in the major averages? 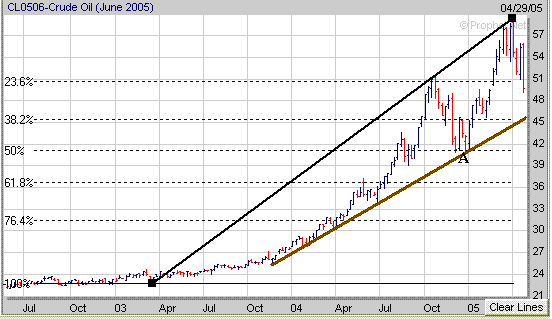
As far as the major averages the Dow so far has been stuck in
a trading range (TR) the past two weeks between 10000 and 10260. In
addition the Dow's downward sloping trend line originating from the early March
low (solid red line) also comes into play around the 10260 area as well.
Eventually there appears to be two possible scenarios for the Dow at some point.
The first scenario would be for the Dow to break above 10260 leading to a
potential rally up to the 10400 to 10500 range which is where its 50 Day EMA
(blue line) and 200 Day EMA (green line) reside at near 10400 while the 10500
area is near the Dow's 38.2% Retracement Level. Meanwhile the second
possible scenario would be for the Dow to break below its 10000 support level
leading to a drop back to its August 2004 low near 9700 (point B). 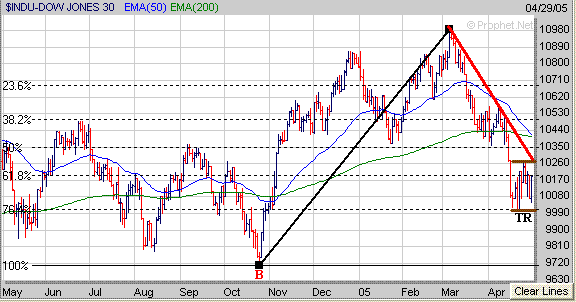
The Nasdaq has been in a persistent downtrend (denoted by
solid brown line) since early January and so far has been unable to break above
its 50% Retracement Level near 1970 (calculated from the August low to the early
January high) the past two weeks. If the Nasdaq attempts to rally once
again look for upside resistance around 1970. Meanwhile if the Nasdaq
continues to trend lower look for its next area of support around 1855 (point C)
which corresponds to its 76.4% Retracement Level. In the longer term if
the Nasdaq drops below the 1855 level then that would likely lead to a retest of
its August low near 1750 (point D). 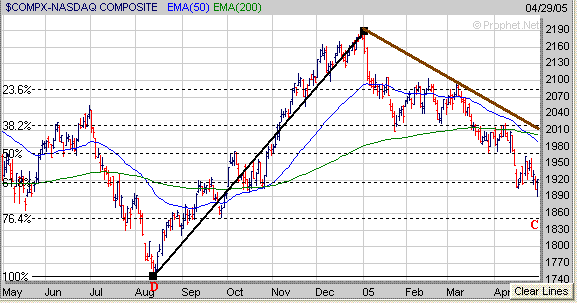
As far as the S&P 500 it has remained in a trading range
(TR) the past two weeks between 1137 and 1163. Eventually this trading
range will be resolved with two possible scenarios. First if the S&P
500 can break above the 1163 area which coincides with its 38.2% Retracement
Level (calculated from the August low to the early March high) and downward
sloping trend line (solid red line) then its next area of upside resistance
would be in the 1177 to 1190 range which corresponds to its 50 Day EMA (blue
line) and 23.6% Retracement Level. Meanwhile if the S&P 500 fails to
hold support near 1137 and continues to trend lower its next area of support
would either be at its 61.8% Retracement Level near 1125 (point E) or at its
76.4% Retracement Level near 1100 (point F). 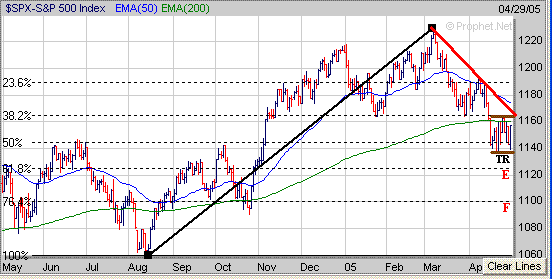
Finally although
the market has been very frustrating to most investors since early March keep
maintaining a list of stocks which are have been holding up well during this
correction. When the market does make a bottom and then begins to
rally again those stocks which break out first will usually be your best
performers. GILD is a stock which has formed the
right side of a 7 month Cup and now needs to work on developing a constructive
Handle over the next few weeks to complete a "Cup and Handle" pattern. 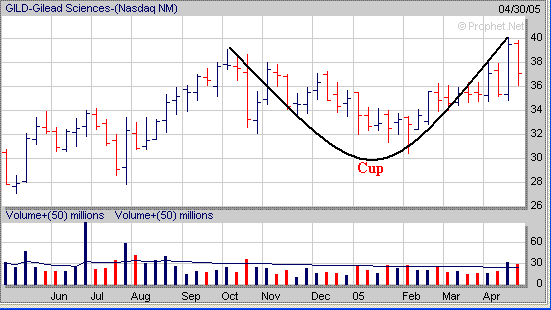
Signup today for a "Free"
2 Week Trial Membership and have access to our Stocks
to Watch List which provides a list of Stocks that are exhibiting a
favorable Chart Pattern such as the "Cup and Handle", "Double
Bottom" and "Flat Base". Also you
will receive our Daily Breakout Report
by email which Alerts you to Stocks that
are breaking out of a favorable Chart Pattern from our Stocks
to Watch List.
Amateur Investors Performance versus the Major Averages
(1/1/05-4/29/05)
Amateur Investors: +12.5%
Dow:
-5.5%
Nasdaq:
-11.7%
S&P
500:
-4.5%
Click
Here to signup for a "Free" 2 Week Trial Membership
Amateur-Investor.net
|


