|
Signup
today and save 50% on a Premium Membership Plan
which includes our Stocks to Watch List and Daily Breakout Reports
Weekend Stock Market Analysis
(4/3/04)
The rally from oversold conditions followed through this past
week and hopefully we are seeing the development of the final upward leg (5th
Wave) to complete a longer term 5 Wave Pattern based on Elliot Wave
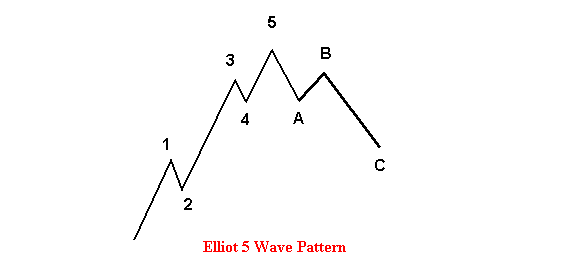
Theory. Once again a simplified chart of an Elliot 5 Wave Pattern is shown
below. Notice how Waves 1,3 and 5 are upward moves with Wave 3 lasting
the longest while Wave 5 is the shortest. Meanwhile also notice
that Waves 2 and 4 are corrective Waves which only last for a brief period of
time before the upward trend continues. Also notice that once the 5
Wave pattern completes itself that this is followed by a longer term correction.
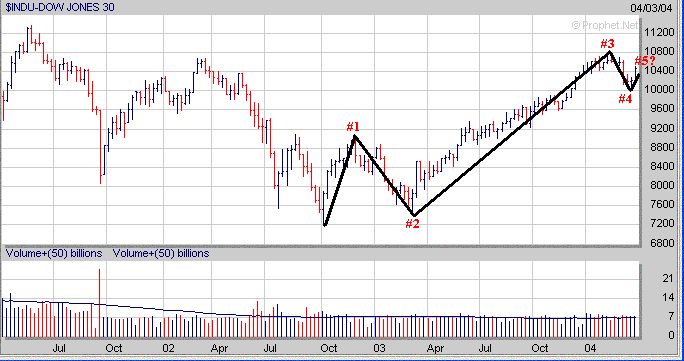
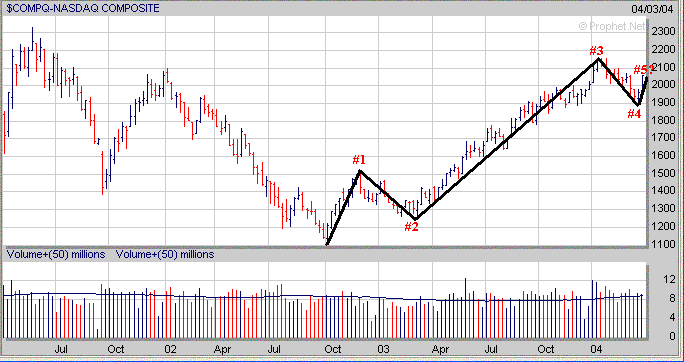
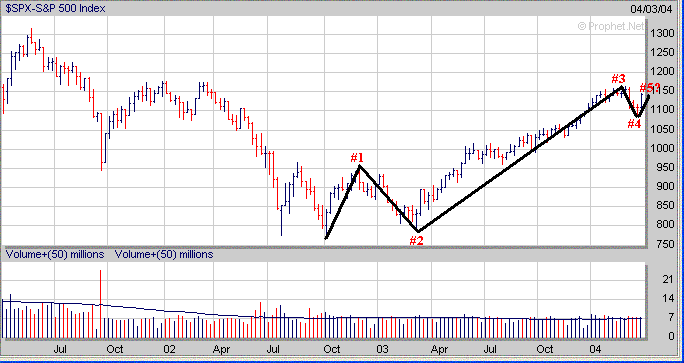
As talked about above is last weeks rally the end of the
corrective 4th Wave and the beginning of the final upward moving 5th Wave?
Keep in mind if we are seeing the development of the final
upward moving 5th Wave this rally will have a shorter duration than the previous
two upward moving waves (1st and 3rd Waves). The first upward wave began
in October of 2002 and lasted only 2 months so if a similar pattern develops
then the final upward moving 5th Wave could peak within in a month or two.
As far as the near term the major
averages have quickly reversed from being oversold to now being somewhat
overbought. The Volatility Index (VIX) has quickly dropped after
peaking a few weeks ago as the S&P 500 was nearing a bottom. As you
can see when the VIX becomes stretched away from its 10 Day MA (points A) and
the %K Line (associated with the Slow Stochastics) drops below 30 (points C)
this is usually a fairly reliable signal of the market becoming oversold which
may lead to significant upside reversal (points B to D). In the
near term the VIX has quickly become stretched significantly away from its 10
Day EMA in the other direction (point E) while the %K line has risen to around
90 (point F). This indicates to me that the market has become rather
overbought and may have to pullback some and consolidate its recent gains before
making another move higher. 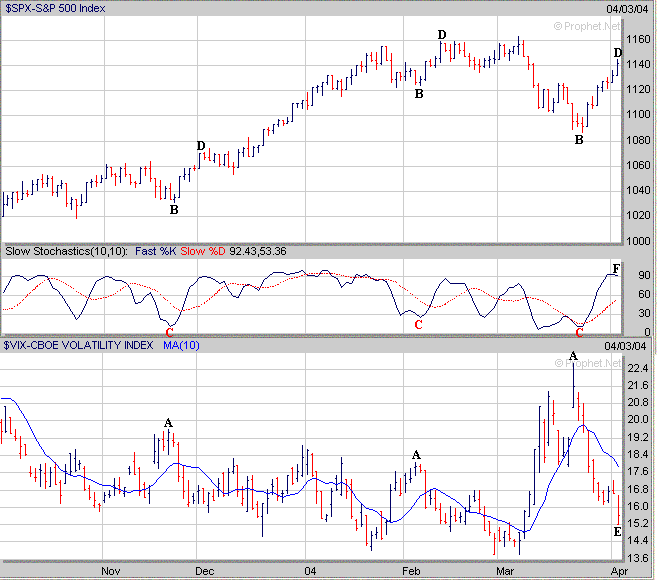
The Dow has risen back
above its 50 Day EMA (blue line) near 10400 and needs to hold at or above it to
remain constructive next week if some type of pullback occurs. Meanwhile if it continues higher I would expect some
resistance to develop near 10600. 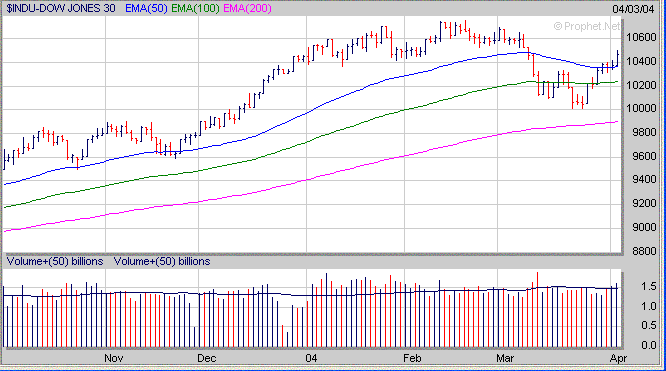
The
Nasdaq has risen 160 points over the past eight trading days and has rallied
back above its 50 Day EMA but may encounter some resistance next week near 2070
(point G) or 2090 (point H). Meanwhile if the Nasdaq pulls back some next
week I would look for initial support near its 50% Retracement Level (calculated
from the January high to the March low) around 2025. 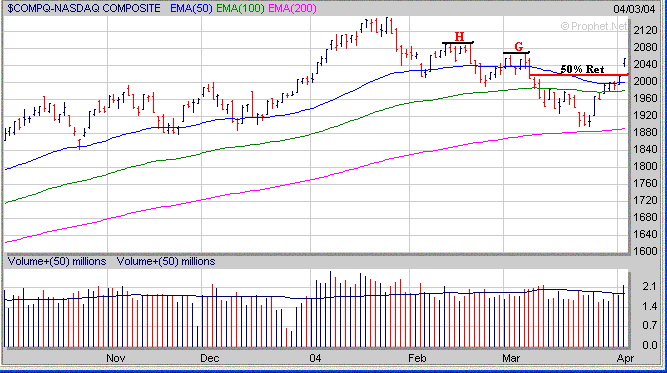
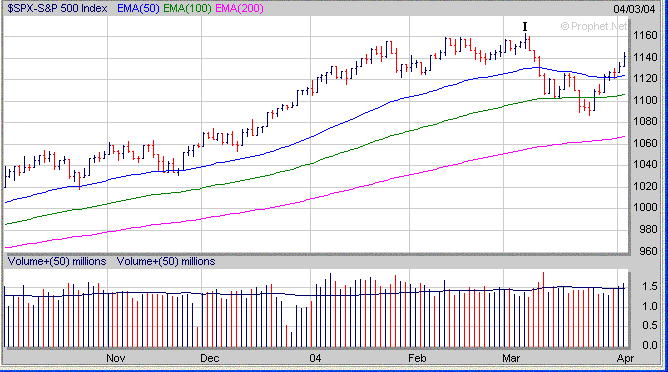
The S&P 500 has also risen back above its 50 Day EMA and
will likely encounter resistance near its previous high near 1160 (point I) if
it continues higher next week. Meanwhile if the S&P 500 pulls back
some next week I would look for support in the 1125 to 1134 range.
Finally when the market is going through a correction it's
important to keep an eye on those stocks which are holding up well and
developing a favorable chart pattern as those will usually provide the best
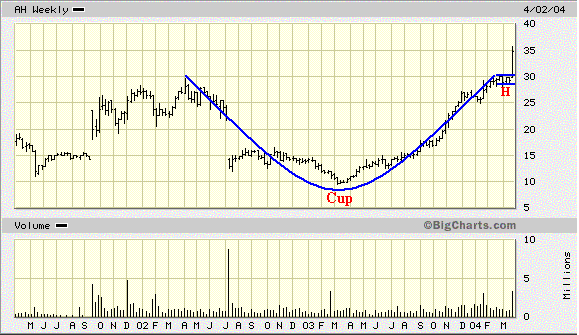
opportunities once the market makes a bottom and begins to rally. AH
which held up well as the market corrected in February and March developed a
classic "Cup and Handle" pattern before breaking out this past week
accompanied by an increase in volume. Before breaking out last week
AH was in our "Stocks to Watch List" based on its developing favorable
chart pattern.
 How can a Premium Membership to amateur-investor.net
benefit you as an investor? We focus on stocks which are exhibiting
favorable Sales and Earnings Growth that have developed a favorable chart pattern such as a "Cup and Handle",
"Double Bottom", "Flat Base" or "Symmetrical
Triangle". These stocks are then
included in our "Stocks to Watch List" which gives investors a
quick reference to those stocks which may provide the best buying opportunities
to the long side in the weeks ahead. Each stock in
our "Stocks to Watch List"
includes specific Buy Prices, Stop Loss Prices (very important) and projected
Target Prices. Signup
Today for a "Free" Trial Membership
and see which Stocks to Buy or Short in the weeks ahead
Amateur-Investor.net
|


