|
Click
Here to Signup for a Free 2 Week Trial Membership and
have access to our Stocks to Watch List and Daily Breakout Reports
Weekend Stock Market Analysis
(4/9/05)
The major averages attempted to follow through on their bounce
from oversold levels this week however they can under selling pressure on
Friday. The Dow has encountered selling pressure twice at its 100 Day EMA
(green line) just above 10550 during the past six trading days. If the Dow
comes under more selling pressure next week look for support near 10350 which
corresponds to its 50% Retracement Level (calulated from the October 2004 low to
the early March high). If the Dow drops below 10350 then its next support
area would be at its 61.8% Retracement Level near 10200 (point A).
Meanwhile if the Dow attempts to reverse to the upside look for resistance in
the 10550 to 10600 range which corresponds to its 100 Day EMA and 50 Day EMA
(blue line). 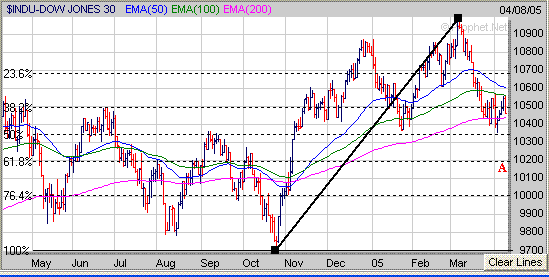
The Nasdaq encountered resistance on
Friday right at its 38.2% Retracement Level (calculated from the August 2004 low
to the early January high) near 2020 and if it comes under more selling pressure
next week look for support at its 50% Retracement Level near 1970. If the
Nasdaq breaks below 1970 this could lead to a quick drop to its 61.8%
Retracement Level near 1920 (point B). Meanwhile if the Nasdaq attempts to
reverse to the upside and can break above 2020 then it has even stronger
resistance near 2040 which coincides with its 50 Day EMA (blue line) and 100 Day
EMA (green line). 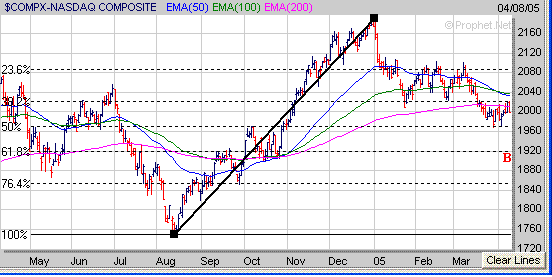
As far as the S&P 500 it briefly
rose just above its 50 Day EMA (blue line) but then came under selling pressure
on Friday and closed right at its 100 Day EMA (green line) near 1181. If
the S&P 500 comes under more selling pressure next week look for support in
the 1160 to 1163 range which corresponds to its 38.2% Retracement Level
(calculated from the August low to the early March high) and its 200 Day EMA
(purple line). If the S&P 500 drops below 1060 then its next support
area would be at its 50% Retracement Level near 1143 (point C). Meanwhile
if the S&P 500 holds support at its 100 Day EMA and rises above 1192 look
for the next area of upside resistance in the 1210-1220 area. 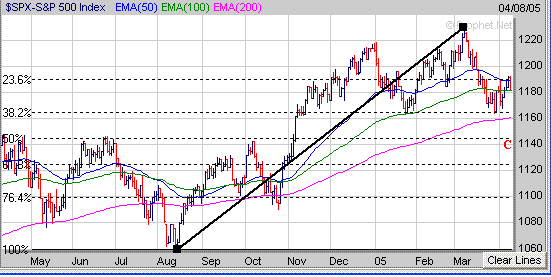
I thought this week I would look at
the longer term chart patterns of the major averages and talk about the Elliot 5
Wave patterns again. For those not familiar with an Elliot 5 Wave pattern
a simple example is shown below. Note that Waves #1, #3 and #5 are upward
moving Waves while Waves #2 and #4 are corrective waves. Meanwhile after
the 5 Wave pattern completes itself this is followed by an ABC type correction. 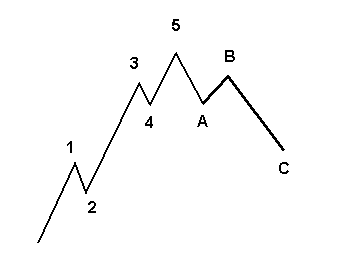
Now
let's examine the major averages. The Dow is exhibiting a 5 Wave pattern
and appears to have a key support level near 10350 (point D). If the final
5th Wave is going to continue then in my opinion the Dow must hold support near
10350. If the Dow breaks below 10350 then this may lead to a longer term
ABC type correction like shown above. 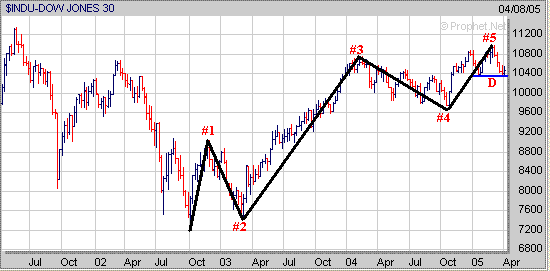
As for the Nasdaq it appears to have
completed its 5 Wave pattern and is undergoing the first downward thrust
associated with an ABC correction. 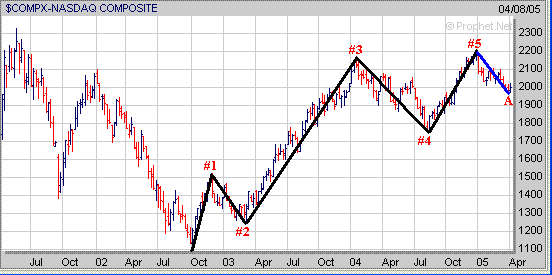
The S&P 500 also is exhibiting a
5 Wave pattern and appears to have a critical support area near 1160
(point E). If the final 5th Wave is going to continue the S&P 500 must
hold support near 1160 otherwise if it doesn't then this could lead to a longer
term ABC type correction. 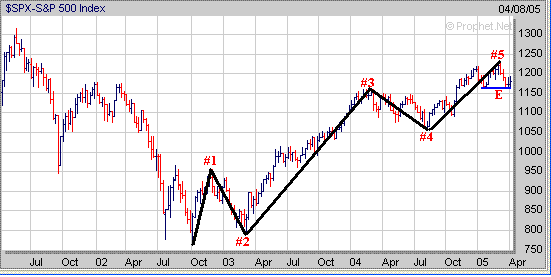
Meanwhile if we look at the
Semiconductors the Semiconductor Holders (SMH) completed their 5 Wave Pattern
in early 2004 and have been in a longer term ABC correction for quite sometime.
The SMH's eventually found longer term support at
their 61.8% Retracement Level (calculated from the October 2002 low to the early
2004 high) near 28 last Fall (solid red line). 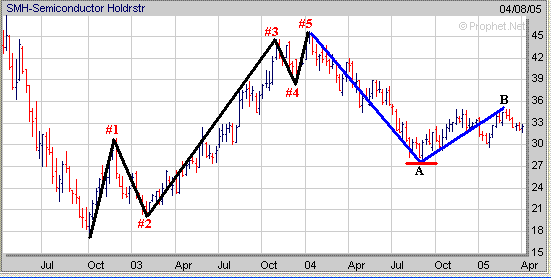
Finally continue to develop a list
of stocks which are holding up well during this correction. For example
ABRX from our Top 100 List has just completed the right of a 21 month Cup and
now needs to start working on developing a constructive Handle in the weeks ahead. 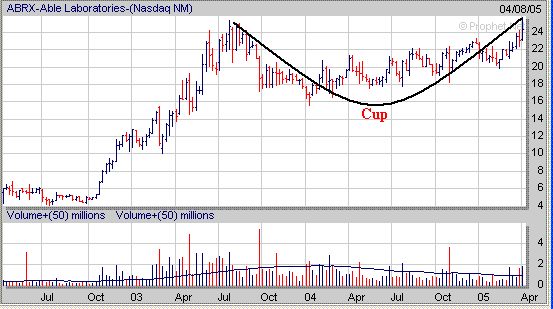
Signup today for a "Free"
2 Week Trial Membership and have access to our Stocks
to Watch List which provides a list of Stocks that are exhibiting a
favorable Chart Pattern such as the "Cup and Handle", "Double
Bottom" and "Flat Base". Also you
will receive our Daily Breakout Report
by email which Alerts you to Stocks that
are breaking out of a favorable Chart Pattern from our Stocks
to Watch List.
Click
Here to signup for a "Free" 2 Week Trial Membership
Amateur-Investor.net
|


