|
Signup
today and save 50% on a Premium Membership Plan
which includes our Stocks to Watch List and Daily Breakout Reports
Weekend Stock Market Analysis
(8/14/04)
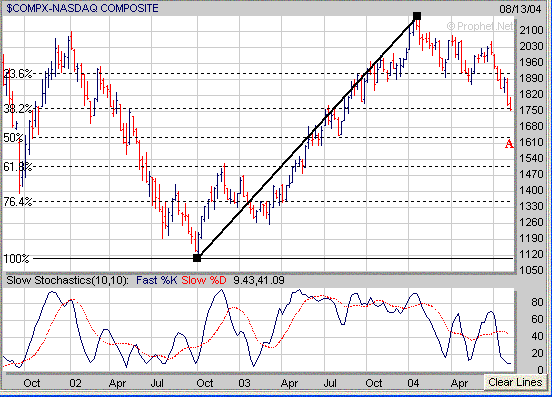
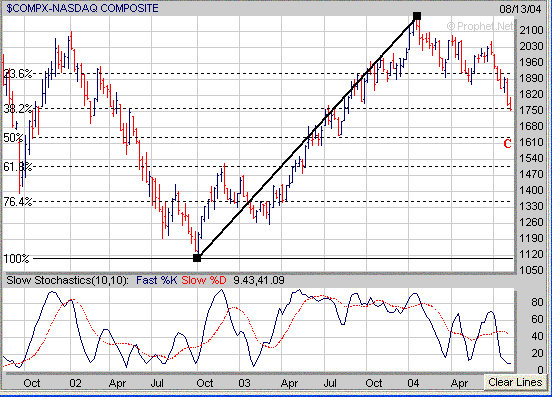
There are a few things to watch closely next week. First the Nasdaq is
now at a key longer term support level at its 38.2% Retracement Level near 1755
(calculated from the October 2002 low to the January 2004 high). If the Nasdaq
is unable to bounce from oversold conditions at this level and then continues
lower its next major downside support area resides at its 50% Retracement
Level around 1630 (point A).
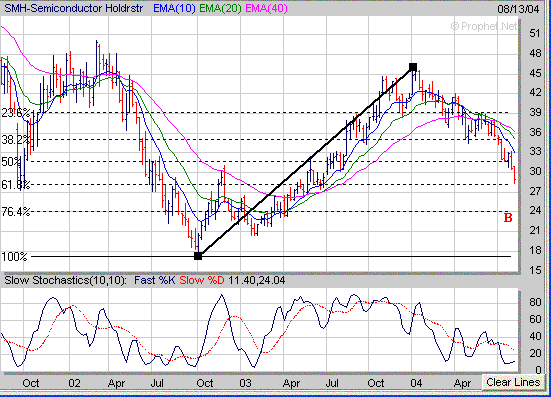
Secondly the Semiconductor Holders (SMH) have now dropped back
to their 61.8% Retracement Level near 28 (calculated from the October 2002 low
to the January 2004 high). The SMH's have fallen nearly 39% since peaking
in early January and if an oversold bounce is going to occur this may be a level
they try and rally from for a few weeks. If the SMH's don't bounce off their 61.8% Retracement Level
and continue lower then their next major downside support area
would be at their 76.4% Retracement Level near 24 (point B).
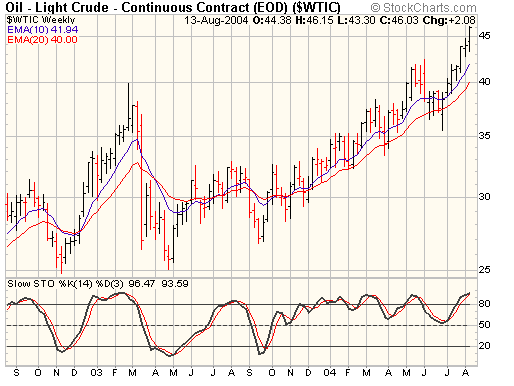
Thirdly I'm watching the Oil sector as well. Although the
price of Crude Oil continues to rise many of the Oil stocks are beginning to
show signs of weakness. Comparing the chart of Crude Oil to that of the Oil
Index (XOI) shows there is a negative divergence developing as the XOI
hasn't been rising in tandem recently with the price of Crude Oil.
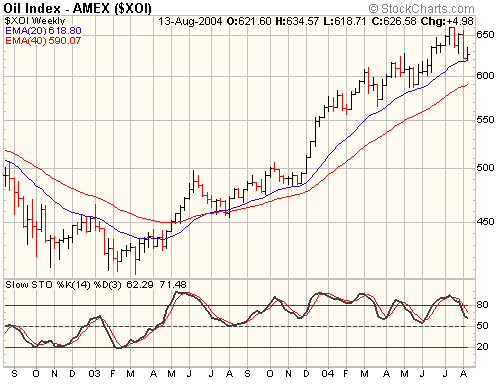
In addition the XOI shows that it has found support since August
of 2003 at its 20 Weekly EMA (blue line) on every pullback while
remaining in an up trend. If the XOI breaks below 620 this would lead to
further weakness in the Oil stocks with a a drop back to its 40 Weekly EMA (red
line) near 590. The question is if further weakness develops in the XOI does
this mean the price of Crude Oil could be getting close to an eventual top and
will the market act positively if this does occur?
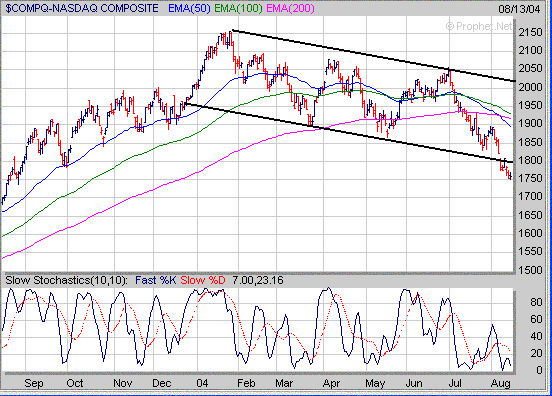
As mentioned in the beginning the Nasdaq is at a key longer term
support area at its 38.2% Retracement Level near 1755. On a daily basis
the Nasdaq has been in a downward trending channel (solid black lines) since
January while making a series of lower highs and lower lows and has fallen
nearly 19% from its peak near 2150. Meanwhile since early July the
Nasdaq has dropped 300 points and is probably due for some type of oversold
rally at some point. If the Nasdaq can hold support near 1755 the
first few days of next week this could potentially lead to some type of sharp oversold
bounce with a potential rally up to its 50 Day EMA (blue line) near 1900.
Meanwhile if the Nasdaq fails to rally off its 38.2% Retracement
Level near 1755 and continues lower its next major downside support area would
be at its 50% Retracement level near 1630 (point C).
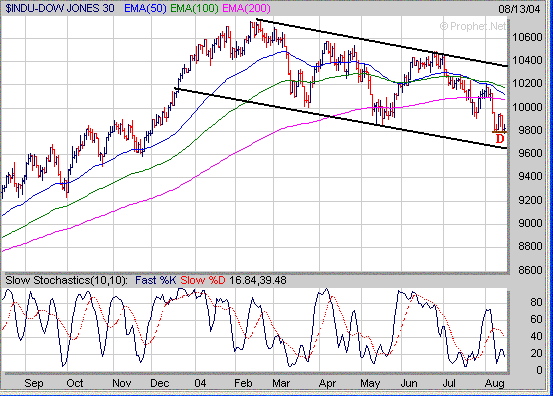
The Dow has also been in a downward trending channel (solid
black lines) while making a series of lower highs and lower lows since February
and has fallen around 9%. This past week the Dow was trying to hold
support near 9800 (point D). If the Dow attempts to bounce from oversold
conditions I would look for initial upside resistance to occur in the 10100 to 10200
range which is where its 200 Day EMA (purple line), 100 Day EMA (green line) and
50 Day EMA (blue line) come into play at.
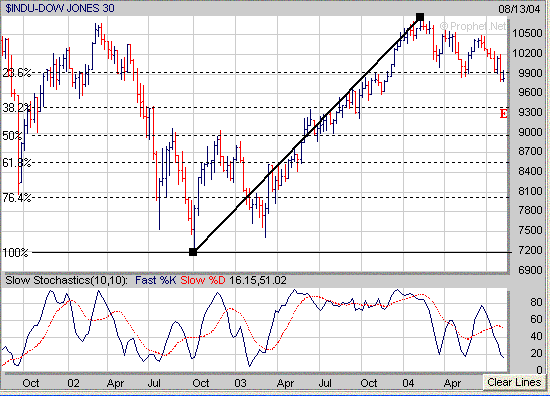
Meanwhile if the Dow fails to hold support near 9800 and
continues lower this could
eventually lead to a larger drop back to its 38.2% Retracement Level
(calculated from the October 2002 low to the February 2004 high) near 9400
(point E) .
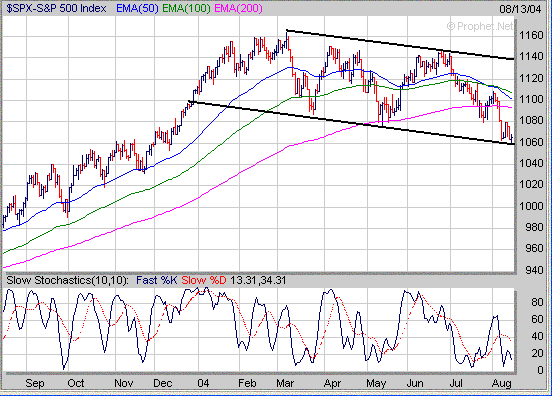
The S&P 500 just like the Dow and Nasdaq has also been in a
downward trending channel (solid black lines) since March and has fallen around
9%. If the S&P 500 attempts to rally from oversold conditions I would look
for initial upside resistance to develop in the 1095 to 1105 range which is where its
200 Day EMA (purple line), 100 Day EMA (green line) and 50 Day EMA (blue line)
come into play at.
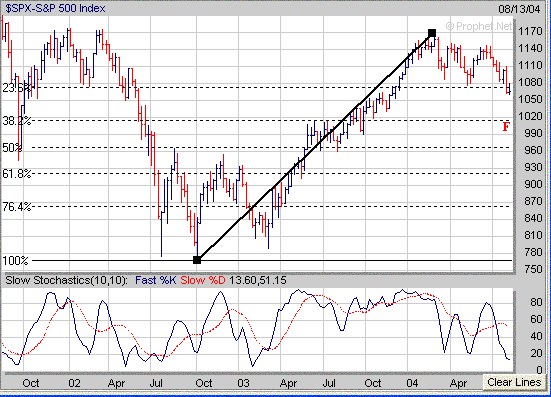
Meanwhile if the S&P 500 doesn't bounce and continues lower its
next major downside support area would be at its 38.2% Retracement Level (calculated from the October 2002 low to the March 2004
high) near 1010 (point F).
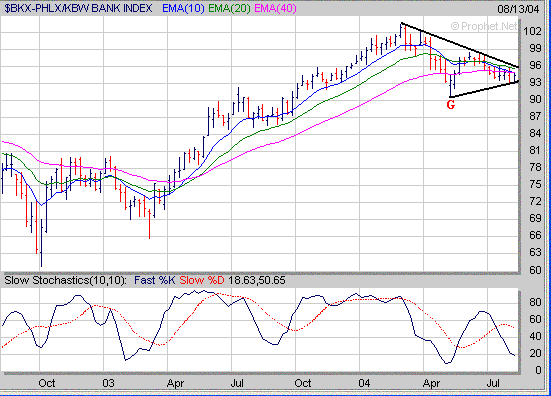
A sector that has considerable weight in the S&P 500 is
the Banks (BKX) which as mentioned over the past few weeks has seen its downward
and upward sloping trend lines converging while developing a descending triangle
pattern. It still looks too me the BKX is going to make a significant move
out of this pattern before much longer. If the BKX breaks above 96 look
for a quick move up to 99 which would have a positive impact on the S&P 500.
Meanwhile if the BKX breaks below 93 look for a quick downward move back to its
May low near 90 (point G) which would have a negative impact on the S&P 500.
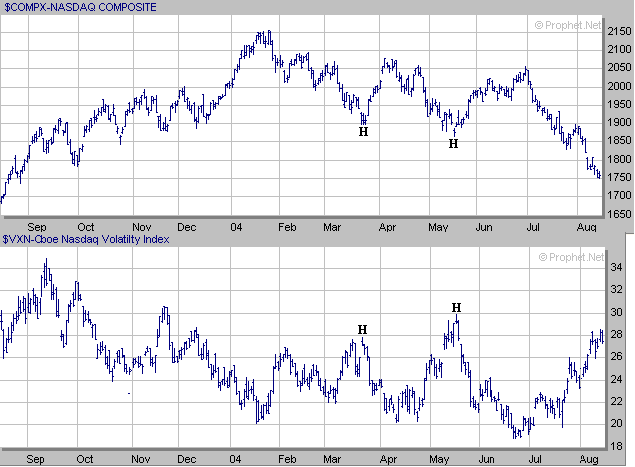
Meanwhile the Volatility Index (VXN) which tracks the Nasdaq 100
remains in the upper 20's and the question remains has enough fear been
generated in the short term to allow for a sustainable bounce to occur similar
to what happened in March and May when the VXN quickly rose into the upper 20's
to around 30 (points H).
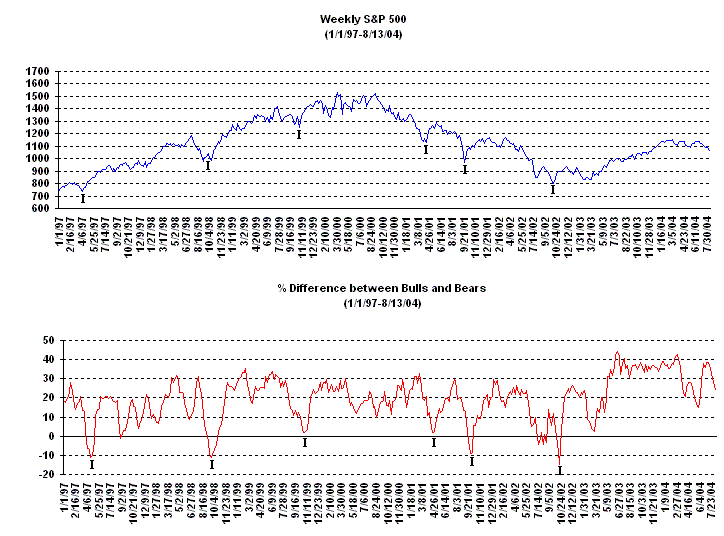
Although the market hasn't been acting well for a several weeks
the Investment Advisors still haven't shown much panic yet as the % difference
between the Bearish and Bullish Investment Advisors is still rather large.
In the past when significant market reversals have occurred the % difference
between the Bearish and Bullish Investment Advisors has narrowed to zero or even
become negative as there were more Bearish Advisors than Bullish Advisors
(points I).
I know it has been frustrating over the past few months as the
market has been trending lower. However the market will likely turn when
most people least expect it too. Thus it's important to notice which
stocks having been holding up the best versus those that haven't been over the
past several weeks. When the market does turnaround those stocks which
breakout first from a favorable chart pattern will likely become the next
leaders and perform the best.
How can a Premium Membership to amateur-investor.net
benefit you as an investor? We focus on stocks which are exhibiting
favorable Sales and Earnings Growth that have developed a favorable chart pattern such as a
"Cup and Handle",
"Double Bottom", "Flat Base" or "Symmetrical
Triangle". These stocks are then
included in our "Stocks to Watch List" which gives investors a
quick reference to those stocks which may provide the best buying opportunities
to the long side in the weeks ahead. Each stock in
our "Stocks to Watch List"
includes specific Buy Prices, Stop Loss Prices (very important) and projected
Target Prices.
Signup
Today for a "Free" 2 Week Trial Membership
and see which Stocks to Buy or Short in the weeks ahead
Amateur-Investor.net
|


