|
Weekend Stock Market Analysis
(8/19/06)
Two things over the past month have allowed the major
averages to put in a low and rally. The first thing is the price of
Crude Oil which peaked in mid July and has been trending lower during the last
four weeks. As we have seen in the past there generally has been an
inverse relationship between the price of Crude Oil and the Dow. When the
price of Crude Oil has risen (points A to B) the Dow has generally sold off (points C to D) and when the price of Crude Oil has fallen (points B
to A) the Dow has usually rallied (points D to C). 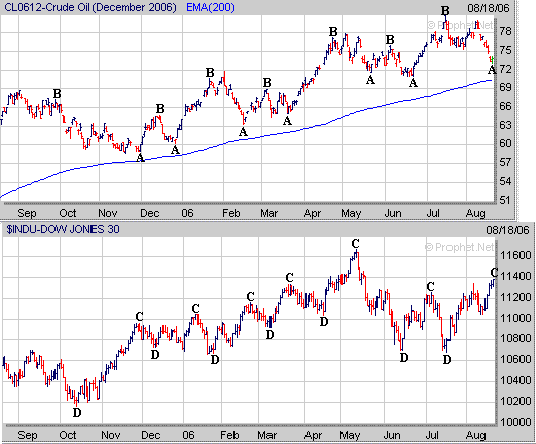
Meanwhile the second thing which has
given a boost to the Nasdaq is the recent strength in the Semiconductors.
The Semiconductor Index (SOX) held support in July at its longer term 50%
Retracement Level (point E) calculated from the September 2002 low to the highs
made in early 2004 and early 2006. 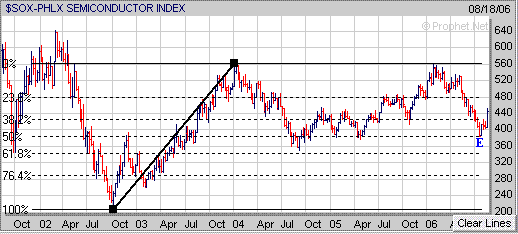
Currently the SOX has rallied back
above its 50 Day EMA (green line) but still remains below its 200 Day EMA (blue
line). In the near term I would expect to see some type of minor
pullback occur in the SOX with the key support level at its 50 Day EMA
near 430. If the SOX can hold support at its 50 Day EMA then this may lead
to a move up to its 200 Day EMA just above the 460 level which will likely act
as a major upside resistance area in the weeks ahead. 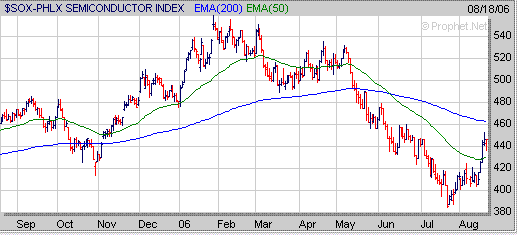
As
far as the major averages the Dow is still exhibiting a potential Double Bottom
pattern (looks like the letter "W") and has risen over 600 points
since the mid July low. If the Dow is going to move higher in the weeks
ahead it should hold support in the 11000 (50 Day EMA) to 11180 (20 Day EMA)
range if a pullback occurs. 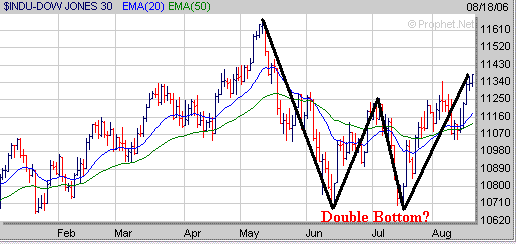
The S&P 500 also is exhibiting a
possible Double Bottom pattern as well although the 2nd bottom wasn't as low as
the 1st bottom. Since the mid July bottom the S&P 500 has rallied
nearly 80 points. As long as the S&P 500 can hold support above its 20
Day EMA (blue line) and 50 Day EMA (green line) on any pullback then its
newly developed up trend will remain intact which could eventually lead to a
rise back to its early May high around the 1325 level. 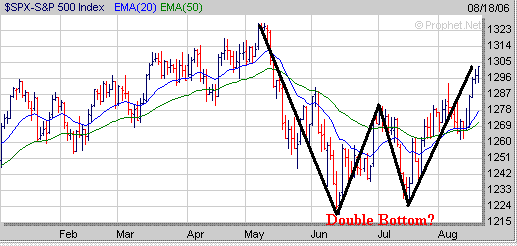
As far as the Nasdaq it has rallied
around 150 points since the mid July bottom and is back above its 50 Day EMA
(blue line). However the Nasdaq still has a significant resistance level
at its 200 Day EMA (green line) near 2175. At this point there are two
possible scenario's in the near term for the Nasdaq. The first scenario
would be for the Nasdaq to rise above its 200 Day EMA leading to a move up to
where it stalled out at in early July near 2190 (point F) which also corresponds
to its 50% Retracement Level (calculated from the April high to the July low) or
the 2235 level which is where it stalled out at in early June (point G) which
coincides with its 61.8% Retracement Level. Meanwhile the second scenario
would be for the Nasdaq to stall out near its 200 Day EMA which would then be
followed by a pullback with support coming in at its 50 Day EMA near
2115. 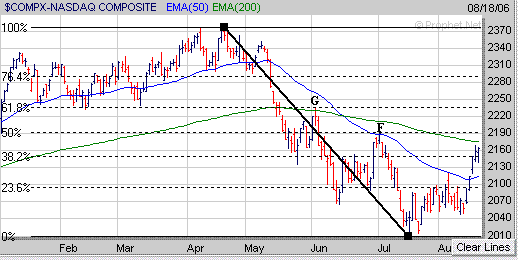
Although we did see an impressive
rally this week one thing to keep a close eye on is the Volatility Index (VIX).
The VIX is quickly approaching a level (black line) that has eventually signaled
a nearing sell off during the past year below a value of 11. If the VIX
continues to drop and falls below the 11 level within the next week or so this
could be a signal of a nearing sell off. Also the last time the VIX rose
rapidly (points H to I) which was then followed by a quick drop (points I to J)
was back in June which was then followed by a substantial sell off in the
S&P 500 (points K to L). Thus keep a close watch on the VIX over
the next week or so because if it drops below 11 this could be a signal of a
nearing sell off as we move into the month of September. Also keep in mind
historically September has been the worst performing month for the market by a
long shot with the Dow being up only 37% of the time since
1900. 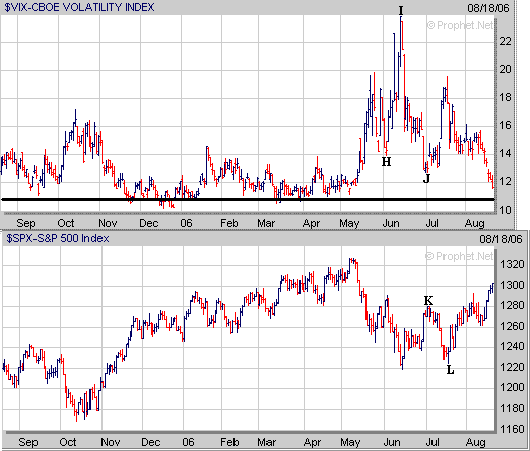
Finally over the past few weeks with
the market acting better more stocks are beginning to form a favorable chart
pattern. For example IAG from our Top 100 List has completed the right
side of a 3 month Cup and now needs to start developing a constructive Handle
over the next few weeks to complete a "Cup and Handle" pattern.
As IAG begins to develop a Handle I would like to see it hold support just above
the $9.60 level (point M). 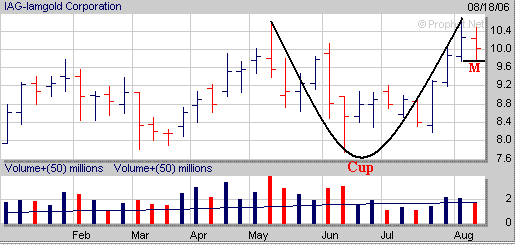 Signup today for a "Free"
2 Week Trial Membership to Amateur Investors and have access to our current Stocks to Watch Buy List which contains stocks that are currently developing a favorable chart
pattern such as the Cup and Handle, Double Bottom and Flat Base which can be used with either our Long Term
Investing Strategy or Short Term Investing
Strategy.
Also you will have access to these other investment products.
Daily Breakout Reports
Daily ETF Signals
Market Timing Indicator
Click
Here to Signup for a "Free" 2 Week Trial Membership
Send this Free Newsletter to a Friend or Relative
Amateur Investors
|


