|
Click
Here to Signup for a "Free" 2 Week Trial Membership and have
access to our Market Timing Indicator and Stocks to Buy List
Weekend Stock Market Analysis
(8/20/05)
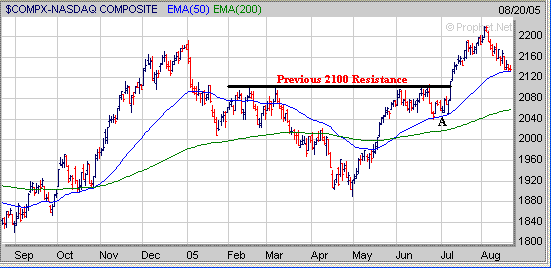
Both the Nasdaq and S&P 500 closed the week at key support
levels and it will be interesting to see what transpires next week. The
Nasdaq has dropped back to its 50 Day EMA (blue line) near 2135 and one of two
things will likely occur. The first scenario would be for the Nasdaq to
hold support at its 50 Day EMA near 2135 and then attempt to rally back to its
previous high earlier this month around 2220. Remember back in late June
and early July (point A) the Nasdaq held support at its 50 Day EMA before
resuming its up trend. Meanwhile the second scenario would be for the
Nasdaq to fail to hold support at its 50 Day EMA leading to a drop back to
either its previous upside resistance area near 2100 or its 200 Day EMA (green
line) which is currently around 2060.
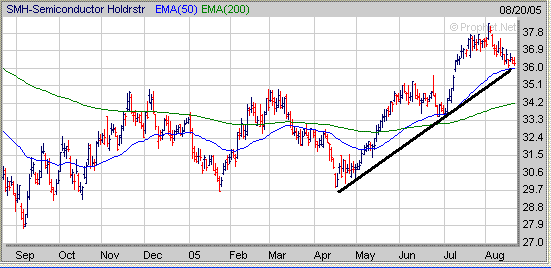
One sector to watch which may have an affect on the Nasdaq is the
Semiconductors. The Semiconductor Holders (SMH) so far have held support
at their 50 Day EMA (blue line) near 36. In addition the SMH's upward
sloping trend line (black line) originating from the April low also comes into
play at the 36 level as well. Thus the 36 area is a key support area to
watch over the next few weeks. If the SMH's can hold
support near the 36 level and then attempt to rally then this would likely have a positive affect on the Nasdaq.
However if the SMH's fail to hold support near the 36 level then this could lead
to a drop back to their 200 Day EMA (green line) near 34.20 which would likely
have a negative affect on the Nasdaq.
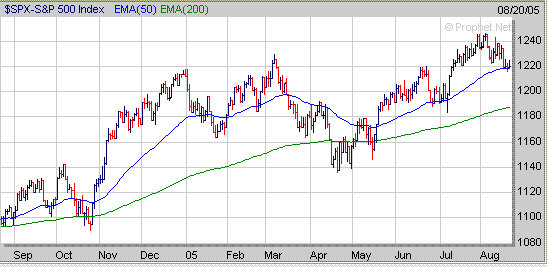
The S&P 500 has dropped back to its 50 Day EMA (blue line) near 1218 which
is a key support level to watch. Just like the Nasdaq I see two potential
scenarios for the S&P 500. If the S&P 500 can hold support near
1218 and then begins to rally it may rise back to its high made earlier this
month around 1245. Meanwhile if the S&P 500 breaks below the
1218 level then it may eventually drop back to its 200 Day EMA (green line) just
below the 1190 area.
 As
for the Dow since mid July it has been basically stuck in a trading range with
resistance just above 10700 (point B) while remaining above its 200 Day EMA
(green line) near 10475. At some point the Dow may have two potential
outcomes in the longer term. First if the Dow can hold support at or above
its 200 Day EMA and eventually break above the resistance area just above 10700
then this could lead to a rise up to the 10850 to 11000 range. Meanwhile
if the Dow is unable to hold support at its 200 Day EMA near 10475 then this
could lead to a drop back to its upward sloping trend line (black line)
originating from the October 2004 low near 10200. 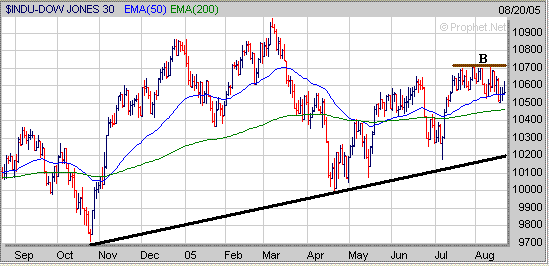
If the major averages especially the
Nasdaq and S&P 500 can hold support at the levels mentioned above and then
begin to rally again focus on those stocks which are breaking out of a favorable
chart pattern. During the past year DNA has been trending higher
after breaking out of a series small Flat Bases (FB) while holding support above
its 10 Weekly EMA (blue line). Currently DNA has developed another Flat
Base during the past 6 weeks while holding support above its 10 Weekly EMA.
Thus DNA would be a stock to watch if the major averages begin to rally
again. 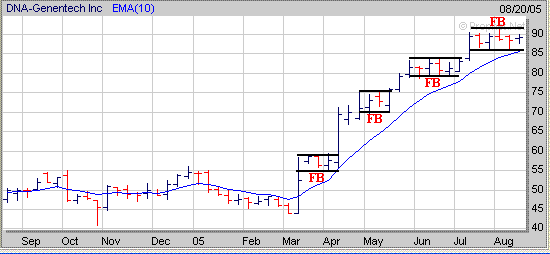
Signup today for a "Free"
2 Week Trial Membership to amateur-investor.net and have access to
our complete list of stocks which are currently developing a favorable chart
pattern in addition to DNA mentioned above.
Also you will have access to these other investment products.
Amateur Investor's Top 100 List
Stocks to Watch Buy List
Daily Breakout Reports
Market Timing Indicator
Weekly ETF Buy and Sell Signals
Click
Here to Signup for a "Free" 2 Week Trial Membership
Amateur-Investor.net
|


