|
Signup
today and save 50% on a Premium Membership Plan
which includes our Stocks to Watch List and Daily Breakout Reports
(This Special Offer will expire on September 1st)
Weekend Stock Market Analysis
(8/21/04)
Last weekend I mentioned there was a possibility of a decent bounce from
oversold conditions as the Nasdaq and Semiconductor Holders (SMH) were at key
longer term support levels and the Volatility Index (VXN) which tracks the
Nasdaq 100 had risen into the upper 20's.
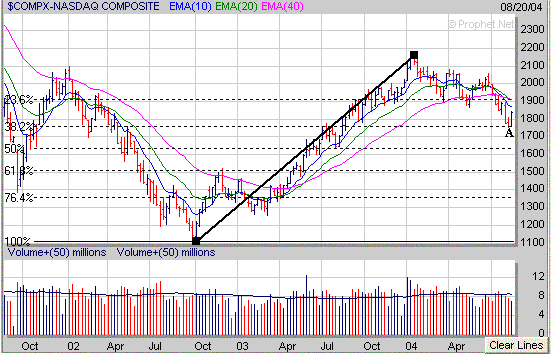
As shown below the Nasdaq found support and rallied off its longer term 38.2%
Retracement Level (calculated from the October 2002 low to the January 2004
high) near 1750 (point A).
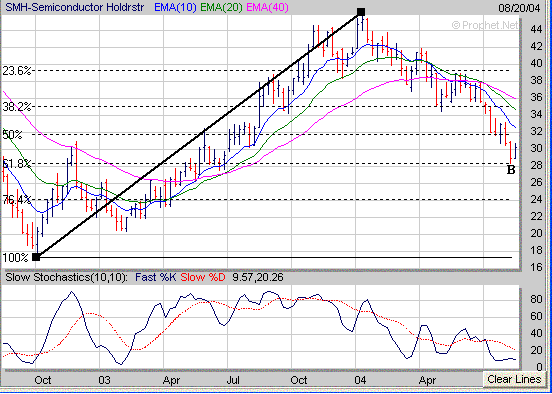
Meanwhile the SMH's found support and rallied off their 61.8%
Retracement Level (calculated from the October 2002 low to the January 2004
high) just above 28 (point B).
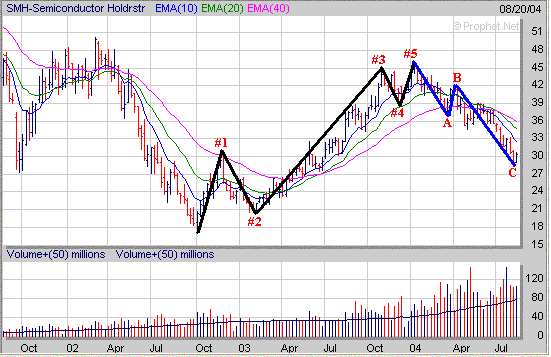
In hindsight it's obvious now the that SMH's completed an Elliot
5 Wave Pattern back in January and is now being followed by an ABC type
correction for those familiar with the theory.
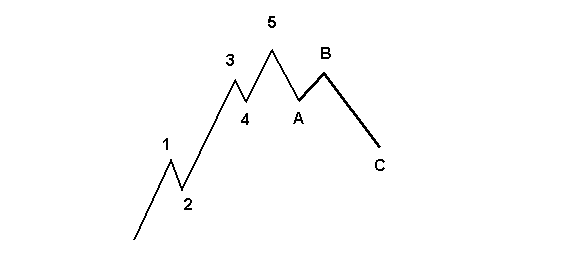
For those not familiar with an Elliot 5 Wave Pattern here is an
example. Notice how Waves 1,3 and 5 are upward moves with Wave 3 lasting
the longest while Wave 5 is the shortest. Meanwhile also notice that Waves
2 and 4 are corrective Waves which only last for a brief period of time before
the upward trend continues. Meanwhile after the 5 Wave Pattern completes
itself this is then followed by an ABC type correction. I will talk
more about this later in this report.
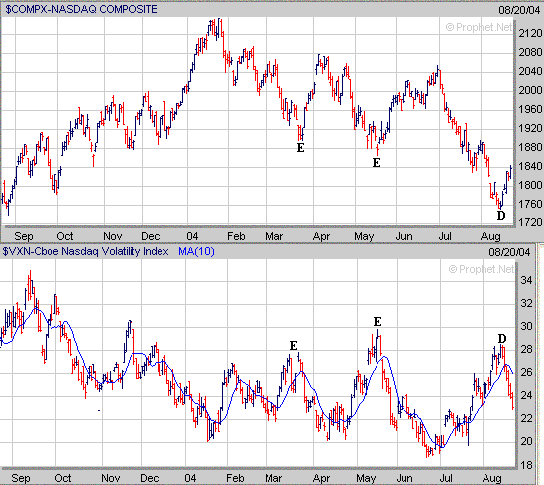
Finally the VXN which tracks the Nasdaq 100 had risen
substantially from July into early August and peaked in the upper 20's (point D)
as fear increased among investors. The same type of pattern also occurred
in March and May as the VXN rose into the upper 20's to around 30 (points E) as
the Nasdaq neared a significant upside reversal.
Now that we have seen a bounce occur the question is how long
will it last and will the major averages eventually stall out and continue their
downward trends?
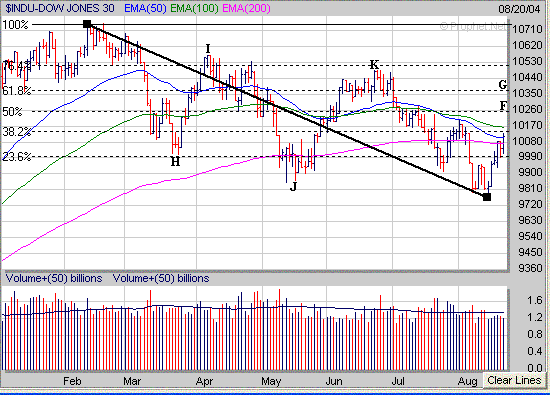
On a daily basis the Dow is now entering into a significant area
of upside resistance in the 10100 to 10170 range which is where its 50 Day EMA
(blue line), 100 Day EMA (green line) and 38.2% Extension Level (calculated from
the February high to the August low) come into play at. It wouldn't be to
surprising to see the Dow possibly stall out for a few days next week near 10170
before going higher and the key short term support level I would watch would be
near 9990. Meanwhile if the Dow does break above 10170 next week its next
two levels of upside resistance would be at its 50% and 61.8% Extension Levels
near 10260 (point F) and 10360 (point G) respectively.
I would also like to point out that when the Dow rallied last
March (points H to I) and again in May (points J to K) it rallied from 560 to
630 points after making a bottom and reversing. The low made just over a
week ago was near 9800 so if we see a similar situation develop then it's
possible the Dow could rally up to the 10360 to 10430 by early September if it
can continue to follow through to the upside.
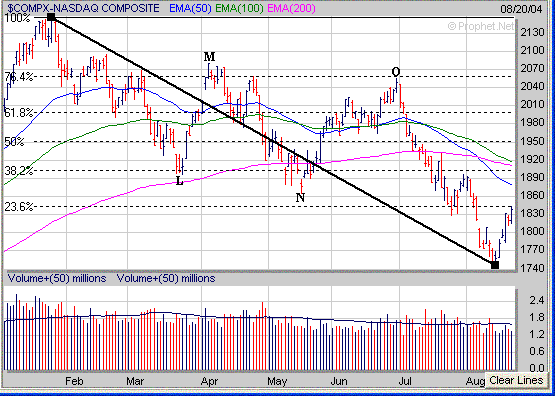
The Nasdaq is now approaching its 23.6% Extension Level
(calculated from the January high to the August low) near 1840 and this could
provide some resistance for a few days next week and I would look for support
near 1815 or so. If the Nasdaq can break above 1840 then I would expect it
to rally up to the 1880-1920 range which is where its 50 Day EMA (blue line),
100 Day EMA (green line), 200 Day EMA (blue line) and 38.2% Extension Level come
into play at.
Furthermore when the Nasdaq rallied in March (points L to M) and
May (points N to O) it gained around 170 points each time after making a
bottom. Thus if the Nasdaq does the same thing this time then it
could potentially rally up to the 1920 area by early September if it follows
through to the upside.
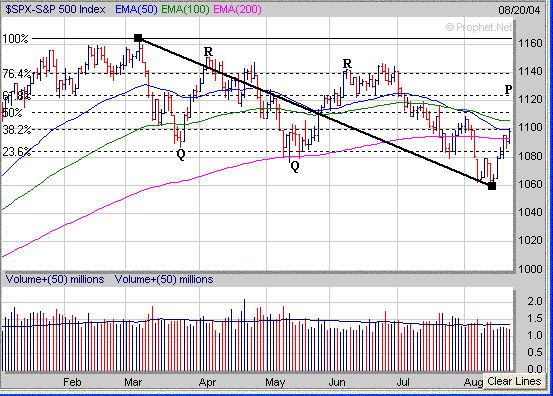
The S&P 500 may encounter some resistance next week in the
1100-1110 range which is where its 50 Day EMA (blue line), 100 Day EMA (green
line), 38.2% Extension Level (calculated from the March high to the August low)
and 50% Extension Level come into play at. If the S&P 500 can break
above the 1110 level then its next upside resistance area would be at its 61.8%
Extension Level near 1123 (point P).
Meanwhile if the S&P 500 follows a similar pattern that
occurred in March and May when it rallied around 60 points each time (points Q
to R) then adding 60 points from the low made just over a week ago near 1060
would yield a value around 1120 or so which is near its 61.8% Extension Level
(point P).
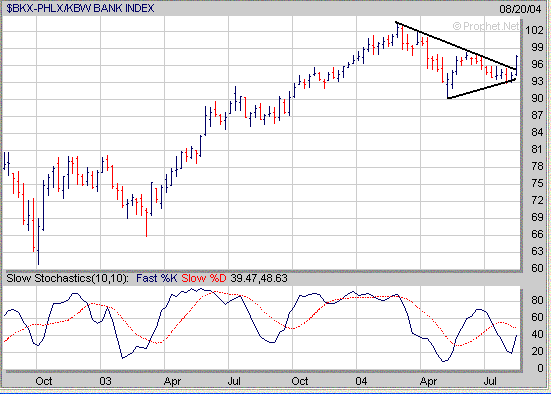
One sector I mentioned to watch last weekend was the Banking
Index (BKX) which has considerable weight in the S&P 500. I said that
it looked like the BKX was getting close to breaking out in one direction or the
other as it had developed a descending triangle pattern as its trend lines
(solid black lines) had narrowed. This week the BKX broke out to the
upside and the level I will be watching next week for possible resistance is
around 99. If the BKX takes out the 99 level then I would expect it to
rally back to its March high near 103 which would have a positive impact on the
S&P 500.
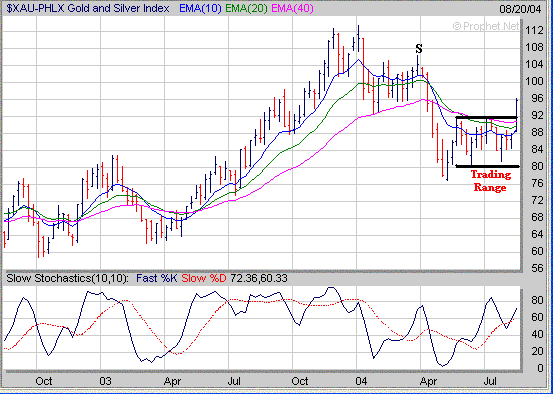
For those of you following the Gold and Silver Index (XAU) the
XAU has broken out of a 12 week trading range and may eventually rally up to
around the 106 area (point S) if it follows through to the upside.
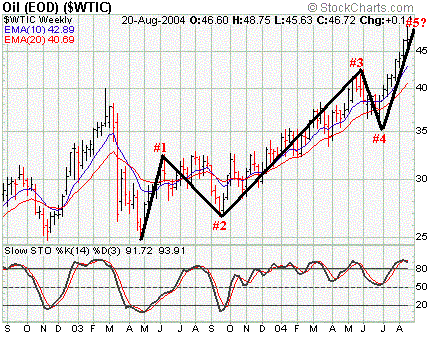
Meanwhile I know the price of Crude Oil continues to be a hot
topic these days however I would point out that it looks too me at least Crude
Oil could be nearing a top as it may be completing the final upward wave (5th
Wave) of an Elliot 5 Wave Pattern. If this is the case then the price of
Crude Oil could eventually pullback to its 10 Weekly EMA (blue line) near 43 or
its 20 Weekly EMA (red line) which is nearing the 41 level. The question
is if the price of Crude Oil begins to drop will this have a positive affect on
the market in the weeks ahead?
When looking for stocks to invest in make sure to focus on those
that have been developing a favorable chart pattern. Some of the typical
chart patterns are the "Cup and Handle", "Double Bottom" and
"Flat Base". Another chart pattern that isn't talked about as
much is the "Symmetrical Triangle" pattern which can lead to a strong
upward move as well.
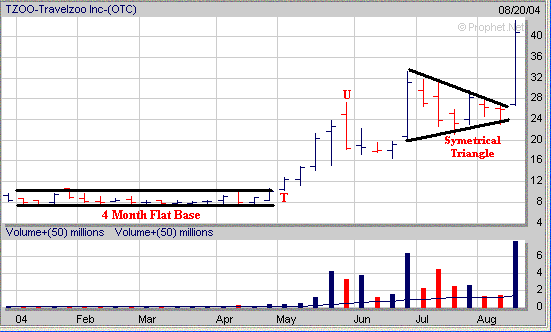
A recent example is TZOO which developed both a Flat Base and
Symmetrical Triangle before making substantial moves upward. Notice how
TZOO traded sideways for 4 months earlier in the year between $8 and $10 and
then broke out in May and quickly gained over 170% in 5 weeks (points T to
U). Next TZOO then developed a Symmetrical Triangle pattern over a 6
week period from July through mid August as its trend lines narrowed (solid
black lines) and then broke out strongly this week as the market rallied from
oversold conditions.
This is why it's important to notice which stocks are developing
a favorable chart pattern even when the market isn't acting well so that when
the market does turn to the upside you are prepared to take advantage of
it.
How can a Premium Membership to amateur-investor.net
benefit you as an investor? We focus on stocks which are exhibiting
favorable Sales and Earnings Growth that have developed a favorable chart pattern such as a
"Cup and Handle",
"Double Bottom", "Flat Base" or "Symmetrical
Triangle". These stocks are then
included in our "Stocks to Watch List" which gives investors a
quick reference to those stocks which may provide the best buying opportunities
to the long side in the weeks ahead. Each stock in
our "Stocks to Watch List"
includes specific Buy Prices, Stop Loss Prices (very important) and projected
Target Prices.
Signup
Today for a "Free" 2 Week Trial Membership
and see which Stocks to Buy or Short in the weeks ahead
Amateur-Investor.net
|


