|
Click
Here to Signup for a "Free" 2 Week Trial Membership and have
access to our Market Timing Indicator and Stocks to Buy List
Weekend Stock Market Analysis
(8/27/05)
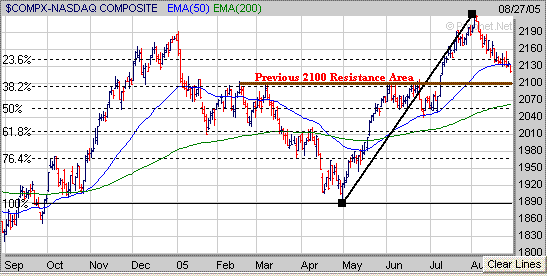
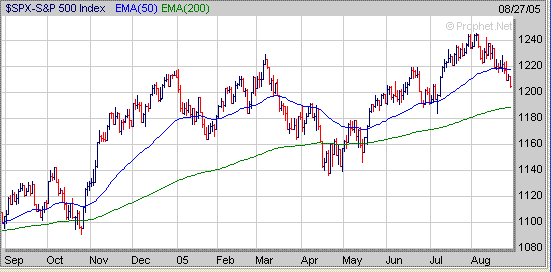
Both the Nasdaq and S&P 500 broke below key support areas at their 50 Day
EMA's this week. The Nasdaq broke solidly below its 50 Day EMA (blue line)
on Friday and its next level of support appears to be at 2100 which was a
previous upside resistance area and also corresponds to its 38.2% Retracement
Level (calculated from the late April low to the early August high). If
the Nasdaq were unable to hold support near 2100 then its next area of support
would be at its 200 Day EMA (green line) near 2065.
The S&P 500 has also broken solidly below its 50 Day EMA (blue line) and its
next level of support would be at its 200 Day EMA near 1190.
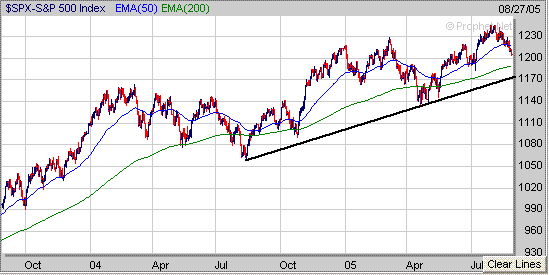
If the S&P 500 were unable to hold support at its 200 Day EMA then its next
area of support would be at its longer term upward sloping trend line (black
line) originating from the August 2004 low near 1170. As long as the
S&P 500 can hold support at this trend line then its upward bias will remain
intact. However if this trend line were to be broken then that wouldn't be
a good sign for the longer term so it will be important for the S&P 500 to
not break below this trend line in the weeks ahead.
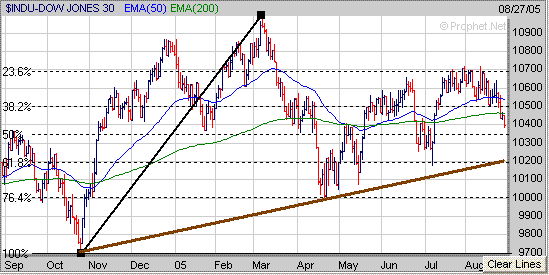
 As
for the Dow it has also broken below its 200 Day EMA (green line) and the next
key support area appears to be around 10200. The 10200 area coincides with its
longer term upward sloping trend line (brown line) originating from the October
2004 low and corresponds to its 61.8% Retracement Level (calculated from the
October 2004 low to the March 2005 high). If the Dow failed to hold
support near 10200 then its next area of support in the longer term would be at
the 10000 level.
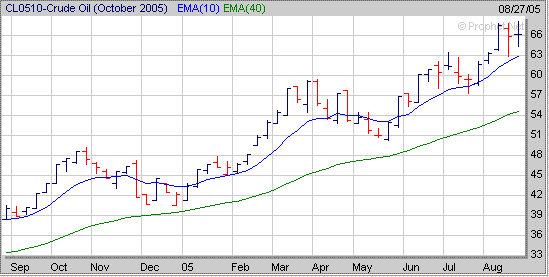
Meanwhile I know this is becoming redundant but continue to watch the price of
Crude Oil. Currently the price of Crude Oil has a key short term support
area at its 10 Weekly EMA (blue line) near 63. If the price of Crude Oil
holds support at or above the 63 level and then eventually makes another move
higher into the 70's this will likely have a negative impact on the major
averages in the weeks ahead. However if the price of Crude Oil were to
break below the 63 level then this could lead to a drop back to the mid to upper
50's which may have a positive impact on the major averages.
I know when the market is under selling pressure it's easy to get discouraged
however this is the time to really start noticing which stocks are holding up
well versus the ones that aren't.
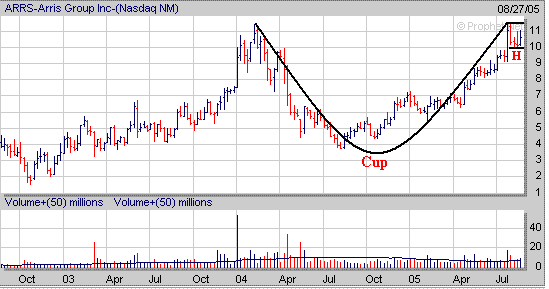
For example here is one from our current Stocks to Watch List. ARRS has
developed a 4 Week Handle after forming the right side of a 1 1/2 year Year Cup
and so far has been holding up well during this correction. The proper
time to buy ARRS would be when it breaks above the top of its Handle which is
just above $11.50.
Signup today for a "Free"
2 Week Trial Membership to amateur-investor.net and have access to
our complete list of stocks which are currently developing a favorable chart
pattern in addition to ARRS mentioned above.
Also you will have access to these other investment products.
Amateur Investor's Top 100 List
Stocks to Watch Buy List
Daily Breakout Reports
Market Timing Indicator
Weekly ETF Buy and Sell Signals
Click
Here to Signup for a "Free" 2 Week Trial Membership
Amateur-Investor.net
|


