|
Signup
today and save 50% on a Premium Membership Plan
which includes our Stocks to Watch List and Daily Breakout Reports
(This Special Offer will expire on September 1st)
Weekend Stock Market Analysis
(8/28/04)
The major averages have now rallied two weeks in a row but they
have been rising on declining volume which could become a problem if upside
volume doesn't begin to pick up next week. The Dow has now rallied above
its 100 Day EMA (green line) and 38.2% Extension Level (calculated from the
February high to the August low). If the rally from oversold conditions
can continue next week I would look for possible upside resistance near 10260
which is at the Dow's 50% Extension Level. If the Dow can break above
10260 then this could lead to a more substantial move up to the 61.8% extension Level near
10380 (point A) which also coincides with the Dow's downward sloping trend line
(brown line) originating from the February high. Meanwhile a key short
term support area to watch next week if the Dow pulls back some would be in the
10075 to 10110 range which coincides with the Dow's 50 Day EMA (blue line) and
200 Day EMA (purple line). 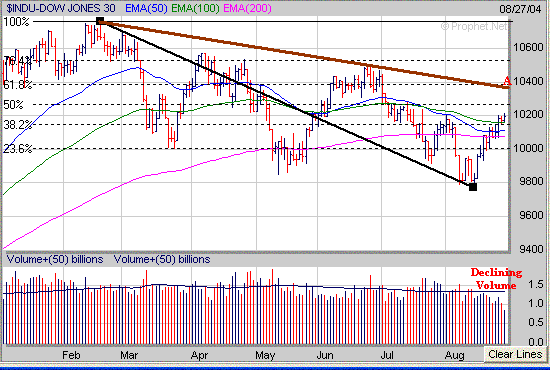
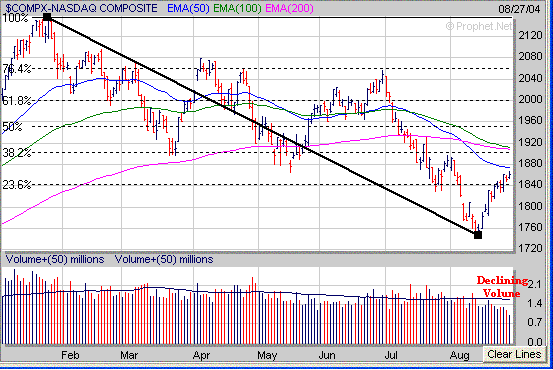
The Nasdaq has
rallied above its 23.6% Extension Level (calculated from the January high to the
August low) however it still hasn't been able to break above its 50 Day EMA
(blue line) near 1875. If the Nasdaq can rally above the 1875 area next
week then look for its next major upside resistance level to come into play in
the 1900-1920 range which is where its 100 Day EMA (green line), 200 Day EMA
(purple line) and 38.2% Extension Level reside at. Meanwhile if the Nasdaq
pulls back some next week look for short term support in the 1830-1840
range.
 As for the S&P
500 it's approaching its 50% Extension Level (calculated from the March high to
the August low) near 1110. If the S&P 500 can break above 1110 next
week then look for the next area of upside resistance around the 1123 level
(point B) which is at its 61.8% Extension Level. Meanwhile if the S&P
500 stalls out near the 1110 area and pulls back some look for short term
support in the 1095 to 1100 range which coincides with its 200 Day EMA (purple
line) and 38.2% Extension Level. 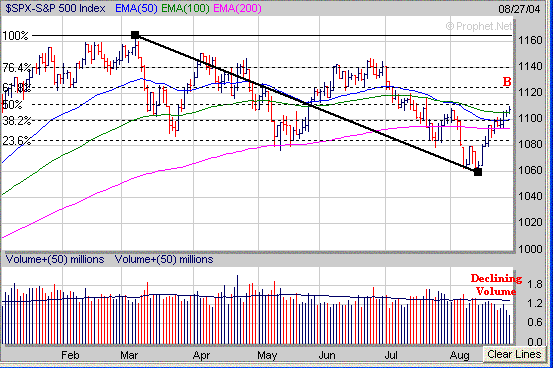
Some sectors to
keep an eye on next week include the Banks (BKX) and the Semiconductor Holders (SMH).
So far the Banks (BKX) have been doing well after breaking out of a descending
triangle pattern just over a week ago which has helped the S&P 500 which is
heavily weighted in Banking stocks. In the short term a key support level
to watch on any pullback would be near the June high just above 98. If the
BKX drops below 98 then its next support area would be around the 96 level which
is where its 50 Day EMA (blue line) and 100 Day EMA (green line) have converged
at. Meanwhile if the BKX continues to rise then it may eventually rally
back to its March high near 103 which would have a positive affect on the
S&P 500. 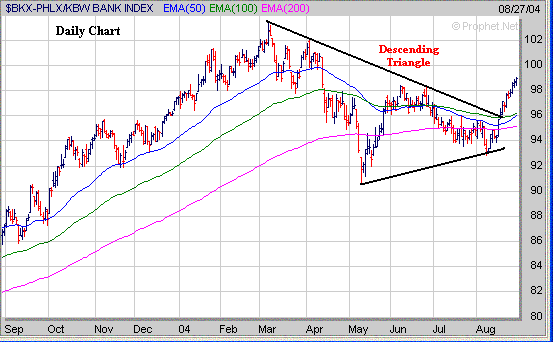
The Semiconductor
Holders (SMH) have been struggling of late and haven't been doing nearly as well
as the BKX. A key support level for the SMH's is just above 28 which is at
their 61.8% Retracement Level (calculated from the October 2002 low to the
January 2004 high). If the SMH's break below 28 this would spell trouble
for the technology laden Nasdaq. Thus we really need to start seeing some
strength in the SMH's if the Nasdaq is going to move higher over the next
week or two. 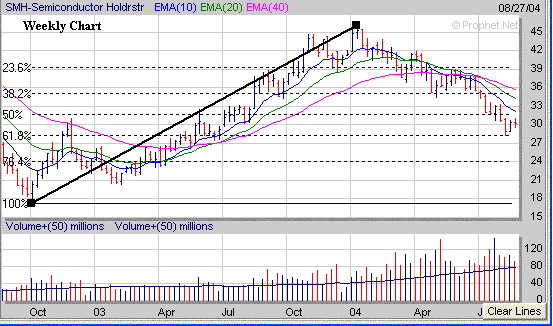
Meanwhile the
price of Crude Oil has dropped back to its 50 Day EMA (blue line) near 42.75 and
has become somewhat oversold on a daily basis. Thus we may see some type
of minor bounce occur in the near term. However if a bounce doesn't
develop and the price of Crude Oil fails to hold support at its 50 Day EMA then
its next support area would be at its 100 Day EMA (red line) near
40.75. 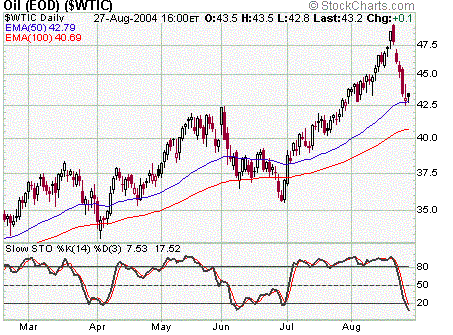
As
far as a few Contrarian Indicators the % difference between the Bearish
and Bullish Investment Advisors continues to drop and is now around 10%.
If this trend continues this could become a good sign for the
longer term. Notice in the past when there has been an equal or greater number of
Bearish Advisors versus Bullish Advisors this has led to some significant
rallies (points C). 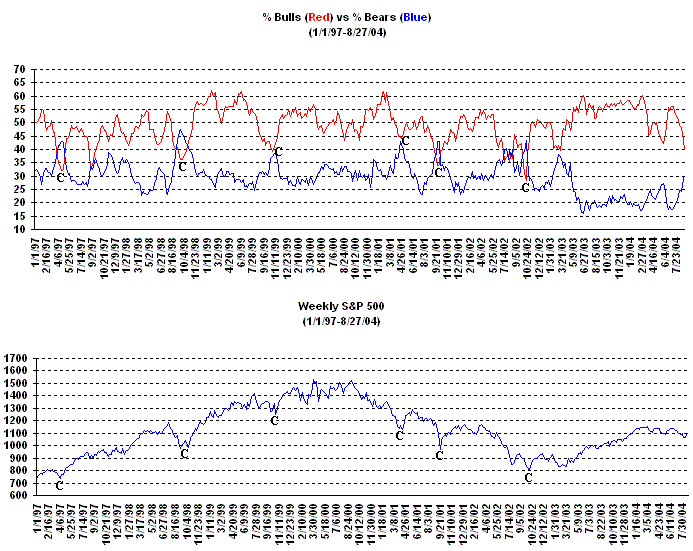
In the short term
one thing that I will be watching closely next week is the Volatility Index (VXN)
which tracks the Nasdaq 100. The VXN has fallen considerably after peaking
in the upper 20's two weeks ago. If the VXN continues lower and drops back
into the upper teens (point D) this could signal a nearing top like we saw in
late June (point E). 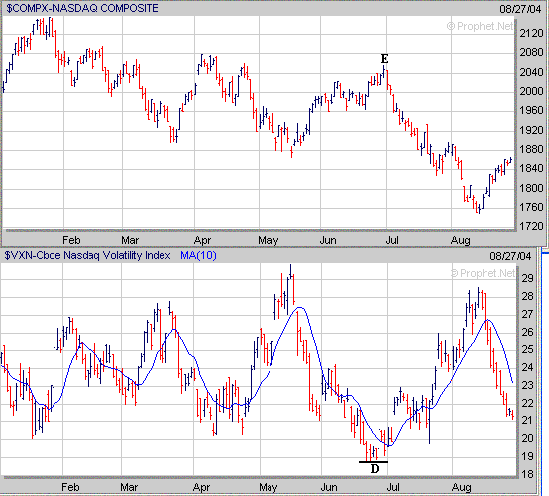
Finally some of you
have asked me to show explain how my Market Timing Indicator (MTI) works. It's
actually rather simple and without getting too technical I will show some recent
examples. Basically what I look for is when the market is becoming
oversold or overbought and may undergo a significant reversal. This
week I will focus on oversold conditions. The first thing I look for is
when the %K Line (light blue line) in association with the Slow Stochastics
drops below a value of 20 and then rises back above it . As you can see
below just because the %K Line drops below 20 and then rises back above it
doesn't always signal a significant reversal as so far in 2004 only 3 out of 7
times did a significant rally from oversold conditions occur in the S&P 500. This is
where the second key thing I look for comes into play and helps determine
whether the %K Line rising above 20 is a valid signal or not. Notice in
the chart below the solid Green and Red Bars in the middle of the chart and how
they transition from either a Red Bar to a Green Bar or vice versa. For
oversold conditions I look for a change in color from a series of Red Bars to a Green Bar
to confirm a significant upside reversal may occur. Thus when
combining these two things together we have had 3 major oversold
events so far in 2004 (late March, late May and just recently) in which the %K Line dropped
below 20 (points F) and then rose back above it and a series of Red Bars then
changed to a Green Bar (points G). 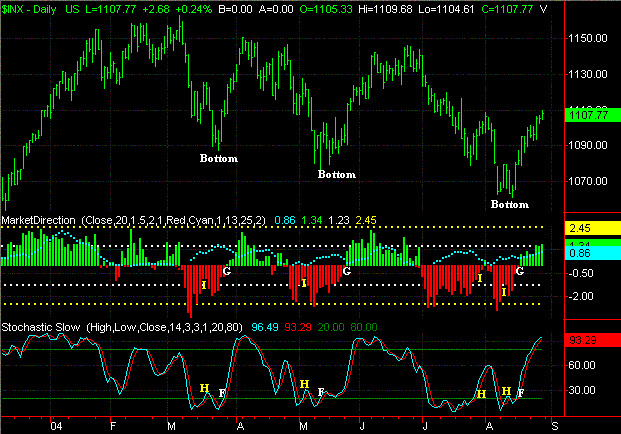
Also you may notice that there
are times when the %K Line drops below 20 and rises back above it (points H)
however there isn't a change of color from a series of Red Bars to a Green Bar
(points I) which means a bottom may still not be in place. This is why
it's important to see a change in color to a Green Bar after after a series of
Red Bars has been in place to confirm a possible bottom and upside
reversal.
Signup today for a 2
Week Trial Membership and have access to our Market
Timing Indicator (MTI) and our Stocks
to Watch List which provides a list of Stocks that are exhibiting
favorable Chart Patterns along with specific Buy and Stop Loss Prices
in addition to Target Prices. For those that like to short
stocks we also a maintain a small list of potential stocks to short as well.
Also you will receive our Daily Breakout Report
by email which Alerts you to Stocks
that are breaking out of a favorable Chart Pattern from our Stocks
to Watch List.
Click
Here to signup for a "Free" 2 Week Trial Membership
Amateur-Investor.net
|


