|
Click
Here to Signup for a "Free" 2 Week Trial Membership and have
access to our Market Timing Indicator and Stocks to Buy List
Weekend Stock Market Analysis
(8/6/05)
The major averages came under some selling pressure at the end
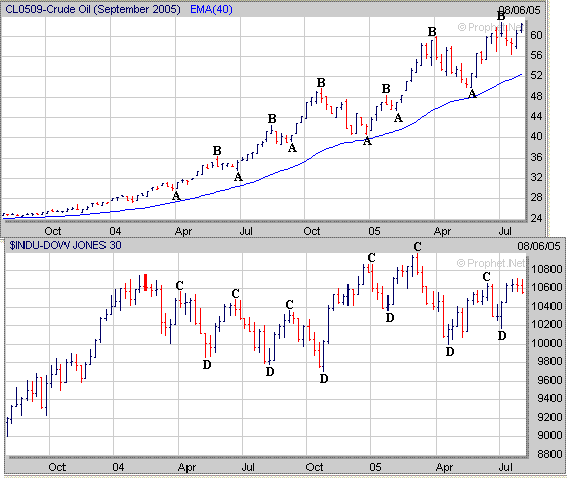
of the week as the price of of Crude Oil has begun to rise again and is nearing
its previous early July high just above 63. I will be keeping a close eye
on the price of Crude Oil over the next few weeks as a substantial rise above
the 63 level could lead to additional selling pressure in the major
averages. As I have mentioned before during the past two years when the
price of Crude Oil has risen (points A to B) this has had a negative affect on
the Dow (points C to D) and when the price of Crude Oil has fallen (points B to
A) this has had a positive affect on the Dow (points D to C).
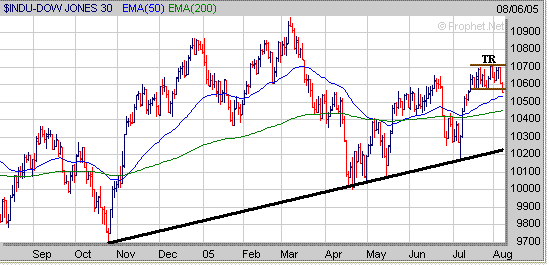
As far as the major averages the Dow which had been in a trading range (TR)
between 10570 and 10700 the past few weeks broke below the bottom of its trading
range on Friday. If the Dow fails to hold support near its 50 Day EMA
(blue line) near 10540 then its next level of support would be at its 200 Day
EMA (green line) near 10450. If the Dow were unable to hold support at its
200 Day EMA then this could eventually lead to a drop back to its upward sloping
trend line (black line) originating from the October 2004 low just above 10200.
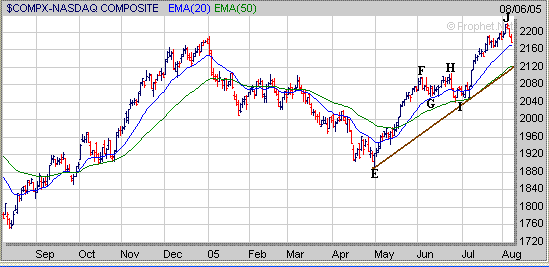
The Nasdaq is nearing its rising 20 Day EMA (blue line) near 2170 and it will be
interesting to see if it can hold support near this level or not. If the Nasdaq
fails to hold support near 2170 then its next area of support would be around
2120 which corresponds to its 50 Day EMA (green line) and upward sloping trend
line (brown line) originating from the late April low. One
thing to keep in mind is that after the Nasdaq made it's last big move from late
April through early June (points E to F) it initially found support at its 20
Day EMA (point G) and then rallied for a few weeks (points G to H).
However the Nasdaq eventually dropped back to its 50 Day EMA in late
June and early July before rallying strongly again (points I to J).
As for the S&P 500 it dropped below its 20 Day EMA (blue line) near 1230 on
Friday and its next level of support would be at its 50 Day EMA near 1215.
The 1215 level will be a key area to watch as a drop below this support level
could lead to an eventual move back to the S&P 500's 200 Day EMA (purple
line) just above 1180.
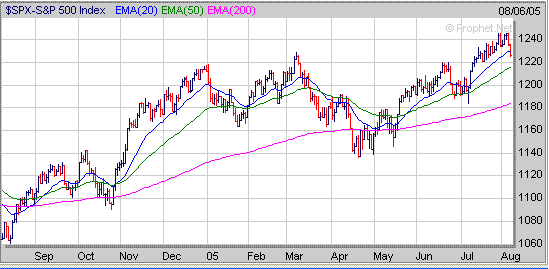
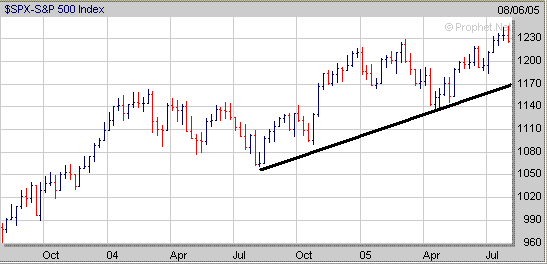
Meanwhile from a longer term perspective as long as the S&P 500 can hold
support at or above its upward sloping trend line (black line) that originates
from the August 2004 low then its upward bias will remain
intact.
Finally it's important to know which sectors are doing well as this is where you
may find your best investment opportunities in individual stocks.
So far in 2005 the Oil sector has been performing well as 7 out of the top 10
performing groups are Oil related (highlighted in blue). If this
trend continues then focusing on stocks in these leading groups may provide the
best opportunities.
|
Total |
| Sector |
Return |
|
2005 |
| Consumer-Misc Products |
52.8% |
| Oil&Gas-Canadian
Explo/Prod |
52.1% |
| Oil&Gas-Canadian
Integrated |
45.6% |
| Oil&Gas-Drilling |
43.9% |
| Oil&Gas-U
S Explo/Prod |
41.3% |
| Oil&Gas-Machinery/Equip |
40.7% |
| Oil&Gas-U
S Integrated |
37.7% |
| Food-Confectionery |
37.6% |
| Oil&Gas-Refining/Mktg |
37.6% |
| Building-Heavy Construction |
36.2% |
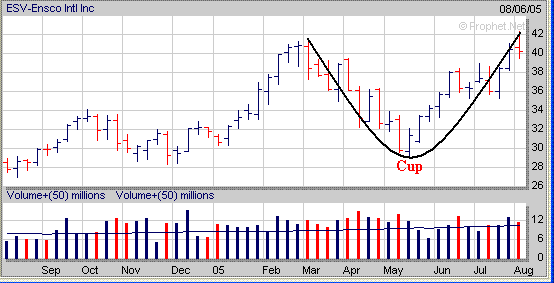
Here is an example of a current Oil related stock (ESV) from our
Top 100 List which has formed the right side of a 5 month Cup and now needs to
develop a constructive Handle over the next few weeks to complete a "Cup
and Handle" pattern.
Signup today for a "Free"
2 Week Trial Membership to amateur-investor.net and have access to the
following useful investment products.
Amateur Investor's Top 100 List
Stocks to Watch Buy List
Daily Breakout Reports
Market Timing Indicator
Weekly ETF Buy and Sell Signals
Click
Here to Signup for a "Free" 2 Week Trial Membership
Amateur-Investor.net
|


