|
Signup
today and save 50% on a Premium Membership Plan
which includes our Stocks to Watch List and Daily Breakout Reports
Weekend Stock Market Analysis
(8/7/04)
The key average to watch next week is the Nasdaq and whether it
will be able to hold support at its key longer term 38.2% Retracement Level near
1755 (calculated from the October 2002 low to the January 2004 high).
Future market direction will likely depend on whether the Nasdaq can find
support at this level or not. If the Nasdaq can hold support near the 1755
level then that would be a positive. However if the Nasdaq drops below
1755 then this would likely lead to an eventual drop back to its longer term 50%
Retracement Level near 1630 (point A). 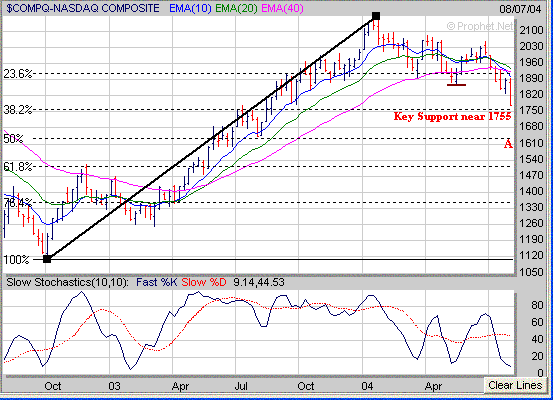
As far as the Dow it has failed to
hold support at its May low near 9850 (point B) and longer term 23.6%
Retracement Level near 9900 (calculated from the October 2002 low to the
February 2004 high). From a technical standpoint it appears the next
major downside support area in the Dow would be at its longer term 38.2%
Retracement Level near 9400 (point C). However the Dow may encounter an
intermediate support zone around 9600 which could lead to some type of oversold
bounce. 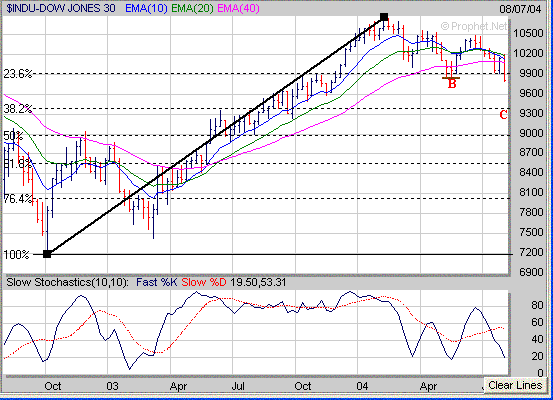
The S&P 500 has also failed to
hold support at its May low near 1077 (point D) and longer term 23.6%
Retracement Level near 1070 (calculated from the October 2002 low to the March
2004 high). Although the next major downside support area for the S&P
500 appears to be at its longer term 38.2% Retracement Level near 1010 (point E)
it could possibly find support somewhere in the 1035-1050 range and undergo some
type of oversold bounce. 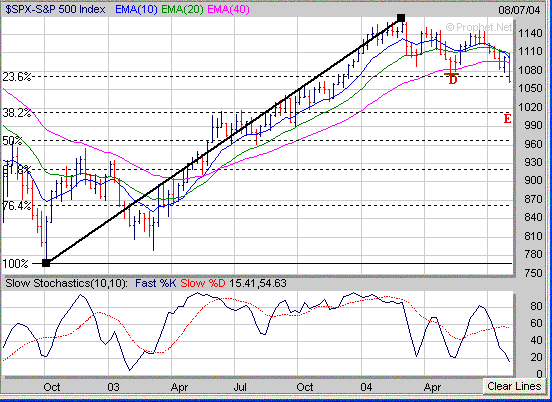
As far as a few sectors the
Semiconductors (SOX) are at a key longer term support area associated with their
longer term 50% Retracement Level near 385. I believe future action in the
market will depend on what the SOX does from here. If the SOX can hold
support near 385 next week this could set the stage for a possible oversold
bounce. However if the SOX breaks below 385 then look for it to drop
back to its 61.8% Retracement Level near 345 (point F) which would lead to
additional selling pressure in the market. 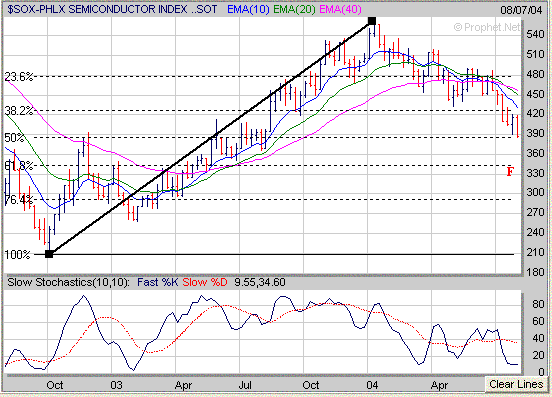
Meanwhile as I mentioned last
weekend the Banks (BKX) had developed a descending triangle pattern as their
downward and upward sloping trend lines (black lines) were converging and looked
like they were going to make a solid move in one direction or the other.
It looks like the BKX is breaking to the downside and the key support area to
watch next week is at the May low just below 91 (point
G). 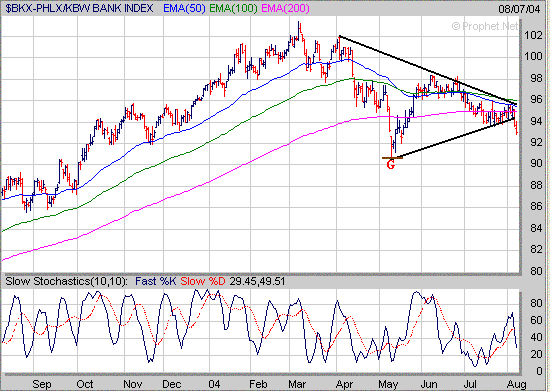
As far as the Contrarian Indicators
we are now seeing more fear develop in the market as both the VIX and VXN are
now rising strongly as investors begin to panic. When the S&P 500 reversed
direction in March and May the VIX rose into the lower to mid 20's (points H). 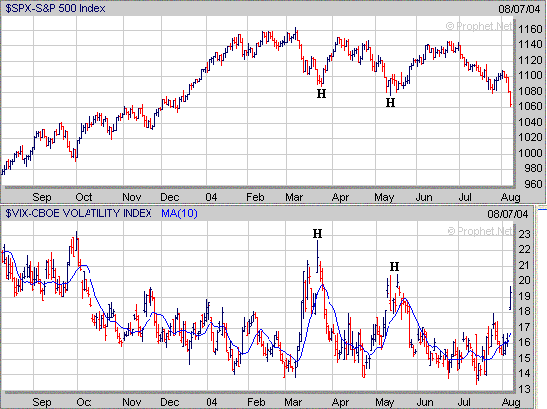
Meanwhile the VXN rose into the
upper 20's to around 30 (points I) when the Nasdaq turned around in March and
May. 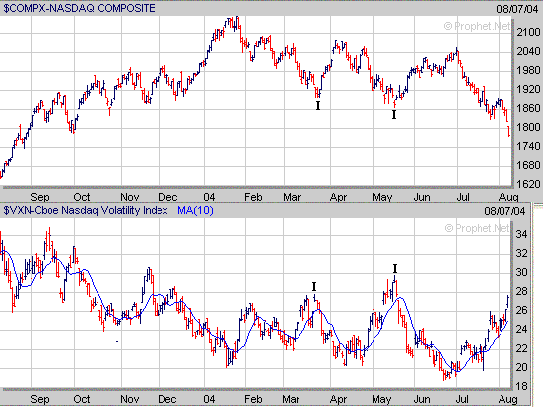
I believe the two things to watch
next week are whether the Nasdaq can find support at its longer term 38.2%
Retracement Level near 1755 and whether the Semiconductor sector (SOX) can hold
support at their longer term 50% Retracement Level near 385. If the Nasdaq
and SOX can find support at the above mentioned levels next week this could lead
to a significant oversold bounce. However if the Nasdaq and SOX fail to
hold support at the above mentioned levels then this will lead to more selling
pressure pressure in the market. Although a majority of
stocks will follow the trend of the market there are always exceptions as money
flows into different sectors. The Steel sector has been very strong for
several months and stocks within this sector have done very well especially
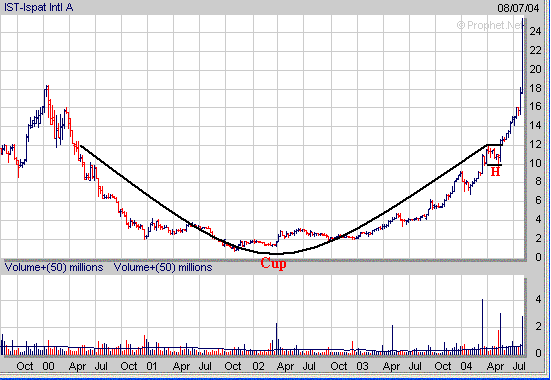
those which have been exhibiting strong Sales and Earnings Growth. An
example of one stock which has done very well is IST. Notice how
IST has seen accelerating Sales and Earnings Growth over the past few quarters
and has doubled in price after breaking out of a "Cup and Handle"
pattern in June. 
How can a Premium Membership to amateur-investor.net
benefit you as an investor? We focus on stocks which are exhibiting
favorable Sales and Earnings Growth that have developed a favorable chart pattern such as a
"Cup and Handle",
"Double Bottom", "Flat Base" or "Symmetrical
Triangle". These stocks are then
included in our "Stocks to Watch List" which gives investors a
quick reference to those stocks which may provide the best buying opportunities
to the long side in the weeks ahead. Each stock in
our "Stocks to Watch List"
includes specific Buy Prices, Stop Loss Prices (very important) and projected
Target Prices.
Signup
Today for a "Free" 2 Week Trial Membership
and see which Stocks to Buy or Short in the weeks ahead
Amateur-Investor.net
|


