|
Weekend Stock Market Analysis
(12/10/05)
The major averages have been basically in a
consolidation/pullback mode for the past two weeks after rise strongly the
previous five weeks. The price of Crude Oil has been rallying since the
first of the month which may be partly responsible for the
consolidation/pullback that has developed. In the past when the price of
Crude Oil has rallied (points A to B) the Dow has generally dropped (points C to
D) and when the price of Crude Oil has dropped (points B to A) the Dow has
generally risen (points D to C). 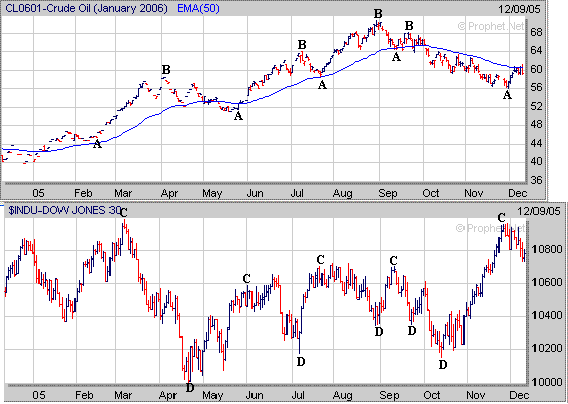 Currently the price of Crude Oil has
risen back to its 50 Day EMA (blue line) and it will be interesting to see what
transpires over the next few weeks as one of two things may eventually
develop. The first thing that may occur is for the price of Crude to stall
out near its 50 Day EMA and then eventually come under more selling pressure
leading to a drop back to the mid 50's which is where it found support at a few
weeks ago (point E). If this scenario were to develop then I would expect
this to have have a positive impact on the major averages as we end the year and
move into the early part of 2006. Meanwhile the second possibility would
be for the price of Crude Oil to break strongly above its 50 Day EMA leading to
a rally back to the mid to upper 60's which would likely have a negative impact
on the major averages in the longer term. 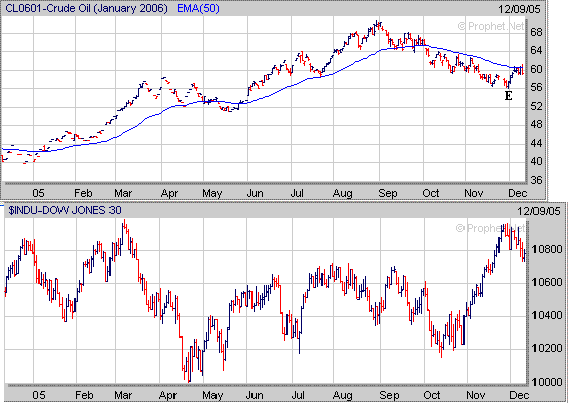
As far as the major averages the Dow
has dropped back to its previous resistance area just above 10700. If the
Dow can hold support near the 10700 area then I would look for it to eventually
rally back to to where it stalled out at a few weeks ago near 10980 by the end
of the year. Meanwhile if the Dow fails to hold support near 10700 then
its next support area would be at its 50 Day EMA (green line) near 10650. 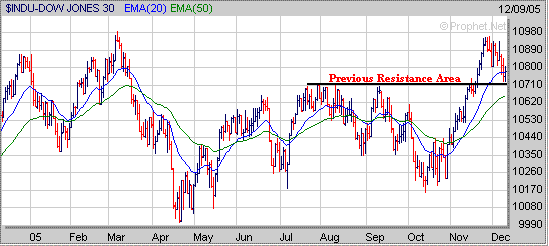
The Nasdaq has been holding support
so far at its 20 Day EMA (blue line) near 2230 and above its previous early
August high around 2220. As mentioned in the Mid Week Analysis the Nasdaq
is exhibiting a similar pattern that occurred early in the Summer when it
rallied strongly for a month (points F to G). This was then followed by a
choppy four week trading range (TR) before the Nasdaq began another move higher
(points H to I). Currently the Nasdaq has been in a choppy trading range
over the past two weeks and if it can break above the 2280 area then it may rise
up to 2330 to 2350 range. Meanwhile if the Nasdaq drops below its 2220
support area then the next level of support would be at its 50 Day EMA
(green line) near 2190. 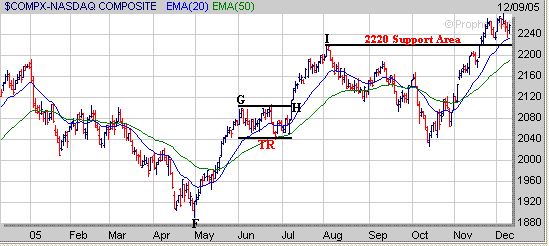
The S&P 500 has been holding
support above its previous early August high and 20 Day EMA (blue line) just
above 1245 while developing a choppy two week trading range. If the
S&P 500 breaks out of this trading range then I would expect a move up to
the 1300 to 1315 range. Meanwhile if the S&P 500 drops below the 1245
level then its next level of support would be at its 50 Day EMA (green line)
near 1235. 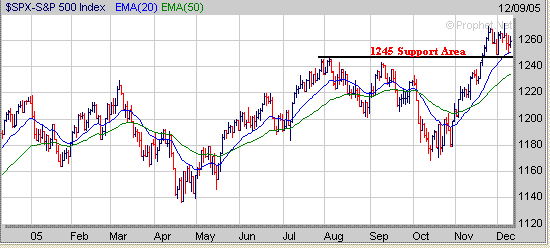
For those of you following the Gold
sector (XAU) the XAU has broken out of a Double Bottom and Handle pattern. 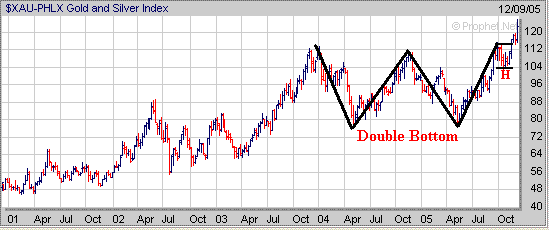
If the XAU can break above its
longer term 76.4% Retracement Level near 130 (point J) then it may eventually
rise up to the high made in 1996 around 155. 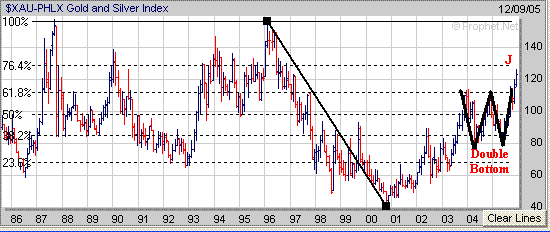
Finally I have seen
PEOPLE claiming that you can now buy stocks breaking out of a Cup pattern without
forming a Handle. Although this may work for a few stocks in most cases
this will lead to a failed breakout attempt. I still believe that it's
better to wait for a stock to develop a constructive Handle and then buy it as
its breaking out of its Handle. A recent
example was QDEL which formed a nice longer term Cup but never developed a
proper Handle before moving higher (points J to K) and then sold off the
past two weeks (points K to L). 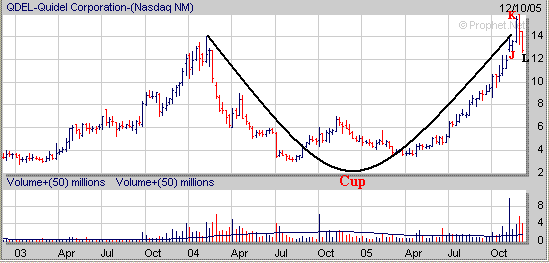
Now lets look at a stock which did
develop a constructive Handle before breaking out. HP formed a long term
Cup and then developed a 15 week Handle before breaking out last June and
continued higher for several weeks (points M to N). 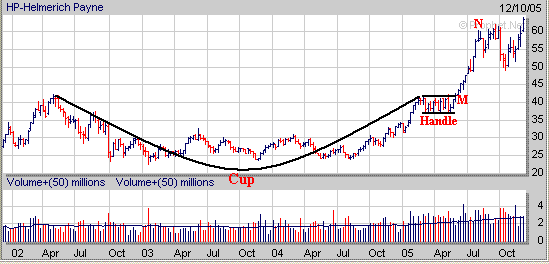
For the year our Long Term
Investing Strategy is up 33% while our Short Term Investing
Strategy is up 65%.
Signup today for a "Free"
2 Week Trial Membership to amateur-investor.net and have access to
our current Stocks to Watch Buy List which contains stocks that are currently developing a favorable chart
pattern which can be used with either our Long Term
Investing Strategy or Short Term Investing
Strategy.
Also you will have access to these other investment products.
Daily Breakout Reports
Market Timing Indicator
Weekly ETF Buy and Sell Signals
Click
Here to Signup for a "Free" 2 Week Trial Membership
Send this Free Newsletter to a Friend or Relative
Amateur-Investor.net
|

