|
Signup
today for a Premium Membership and save 50%
which includes our Stocks to Watch List and Daily Breakout Reports
Weekend Stock Market Analysis
(12/11/04)
All in all the major averages have been holding fairly well
after rising strongly from late October through mid November. The Dow has
been holding support over the past few weeks just above 10400 so that appears to
be a key area to watch in the near term. If the Dow does drop below 10400
its next area of support would be either at its 50 Day EMA (green line) near
10350 or at its 100 Day EMA (purple line) around 10260. Meanwhile in the
near term the Dow has some upside at its recent high near 10640 (point
A). If the Dow can break above 10640 then its next area of upside
resistance would be at its February high around 10750 (point B). 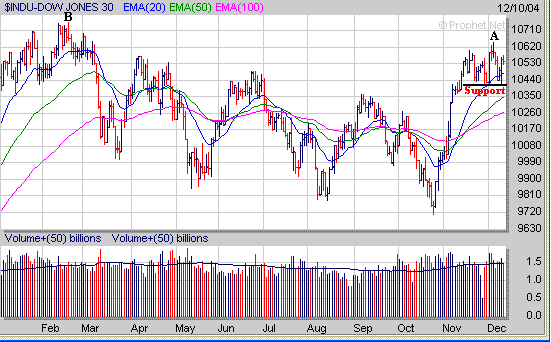
The Nasdaq held support this week at
its rising 20 Day EMA (blue line) near 2100 so that will be a key short term
support area to watch next week. If the Nasdaq drops below 2100 its next
support area would be around 2065 which is at its 23.6% Retracement calculated
from the mid August low to its most recent high. Meanwhile if the Nasdaq
attempts to rally look for upside resistance at its early December high around
2160. 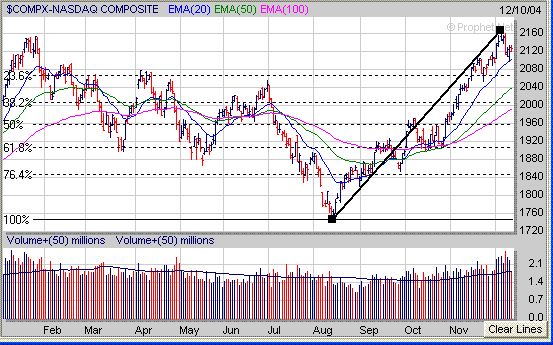
As
for the S&P 500 it has a key support level at its 23.6% Retracement Level
near 1165 (calculated from the mid August low to its recent high) and has upside
resistance at its early December high near 1198. 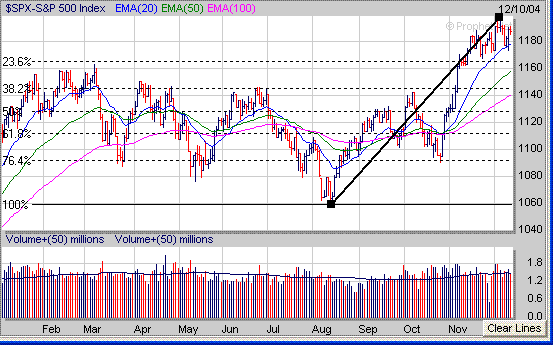
When
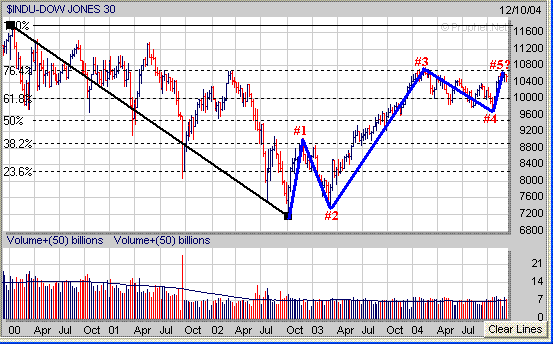
looking at the major averages from a longer term perspective it appears they
might be exhibiting the final 5th Wave of an Elliot Wave 5 Wave Pattern.
For those not familiar with an Elliot 5 Wave Pattern an example is shown below. Notice
how Waves 1,3 and 5 are upward moves with Wave 3 lasting the longest while Waves
1 and 3 are shorter. Meanwhile notice that Waves 2 and 4 are corrective
Waves. Once the Elliot 5 Wave Pattern is complete this is then followed by
a longer term ABC correction. 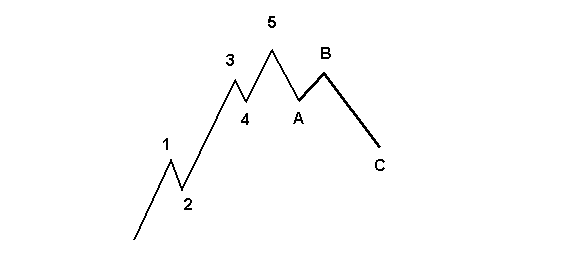
The
Dow appears to be developing its final upward wave (#5) and if it can break
solidly above the 10750 area then it could possibly rally up to its 2001 high
near 11300 before completing its 5 Wave Pattern.
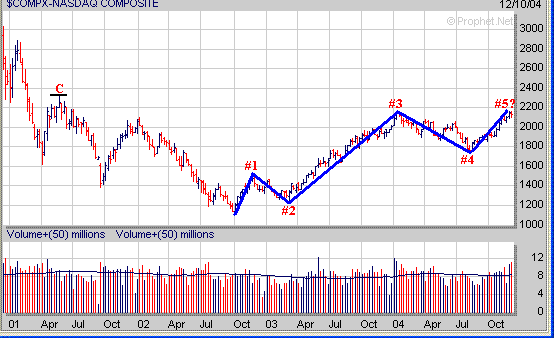
The Nasdaq is exhibiting a similar 5 Wave Pattern and if it can
break above 2200 it may have a chance to rally up to the 2300 area (point C)
before completing its 5 Wave Pattern.
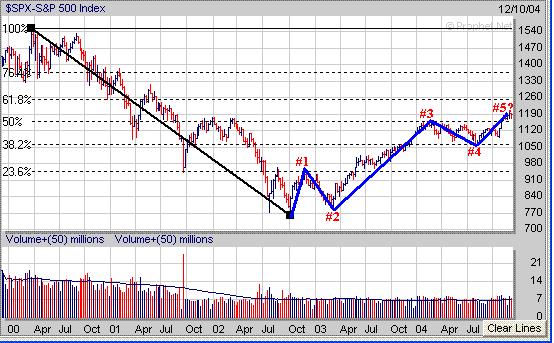
Meanwhile the S&P 500 is also exhibiting a potential 5th
Wave and has longer term resistance to the upside at its 61.8% Extension Level
(calculated from the early 2000 high to the October 2002 low) near 1255.
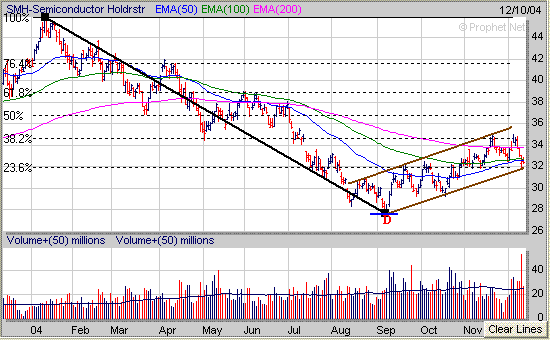
As far as some sectors the Semiconductor Holders (SMH) have been
trading in an upward channel (solid brown lines) since early September.
However the SMH's are at the bottom of their trading channel which also
corresponds to the 23.6% Extension Level (calculated from the January high to
the early September low near 32. If the SMH's fail to hold support near
the 32 level this could lead to an eventual retest of their early September low
near 28 (point D). Thus it will be very important in the near term for the
SMH's to hold support next week around 32. If the SMH's do break strongly
below 32 this could prevent the Nasdaq from rallying strongly into the end of
the year.
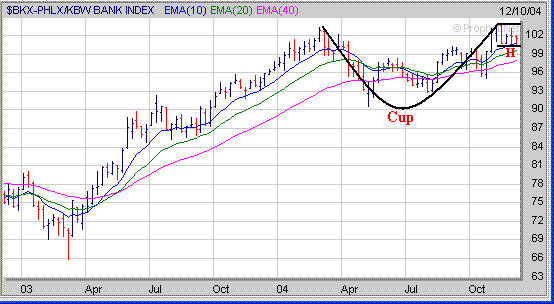
Meanwhile the Banking sector (BKX) is still exhibiting a
constructive "Cup and Handle" pattern as it has developed a 4 week
Handle (H) while holding support near 100.50. One of two things will
probably happen in the BKX in the weeks ahead which will have an impact on the
S&P 500 which is heavily weighted by the Banks. The first scenario
would be for the BKX to break out of its Handle (above 104) to the upside and
make another move higher which would have a positive affect on the S&P
500. Meanwhile the second scenario would be for the BKX to break strongly
below the 100.50 area which would negate its Handle and have a negative affect
on the S&P 500.
Finally looking at Crude Oil it did drop just below its 40
Weekly EMA (purple line) this week and if it continues lower there are two
longer term support levels to watch for based on Retracement Levels. The
50% and 61.8% Retracement Levels (calculated from the 2003 low to the 2004 high)
reside at 39 and 35 respectively.
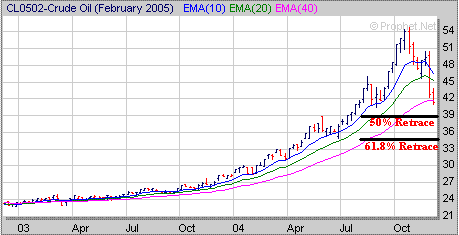
If the price of Crude Oil continues to drop this may help the
major averages rally unless the Banking Sector (BKX) breaks down or the
Semiconductor Holders (SMH) drop strongly below the 32 level as mentioned above.
Finally a lot of investors get frustrated when a stock breaks
out of a favorable chart pattern and they miss the initial breakout.
However sometimes a stock will give you a second or third opportunity to buy it
as it develops another basing pattern before moving higher.
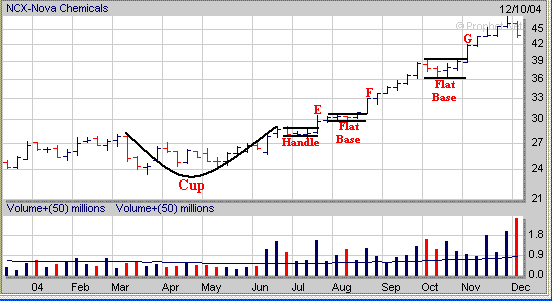
For example let's look at the case of NCX again which initially
broke out of a small "Cup and Handle" pattern last July (point E) on
good volume. As you can see after initially breaking out in July NCX then
traded nearly sideways for four weeks and developed a small Flat Base before
breaking out again in late August (point F). NCX then developed another
four week Flat Base in October before breaking out again in early November
(point G). Thus as you can see even if you missed the initial breakout
last July there were still two other opportunities to buy NCX as it continued
higher through late November.
Signup today for a 2
Week Trial Membership and have access to our Stocks
to Watch List which provides a list of Stocks that are exhibiting a favorable Chart
Pattern such as the "Cup and Handle". Also you will receive our Daily Breakout Report
by email which Alerts you to Stocks
that are breaking out of a favorable Chart Pattern from our Stocks
to Watch List.
Click
Here to signup for a "Free" 2 Week Trial Membership
Amateur-Investor.net
|


