|
Weekend Stock Market Analysis
(12/17/05)
The major averages have been generally in a consolidation
pattern during the past three weeks after making a strong upward move from mid
October through late November. One thing that is starting to
concern me is the amount of complacency that has developed among
investors. Taking a look at the 5 Day Average of the Put to Call Ratio
versus the S&P 500 shows that the Put to Call Ratio dropped substantially
this week and is nearing a value of 0.60 (point A). In the past when the 5
Day Average of the Put to Call Ratio has dropped to around 0.60 (points B) the
S&P 500 has but in a top shortly thereafter. This was then followed by a pullback for several weeks (points C to D) or a substantial sell off
(points E to F). At this point it's hard to say whether this rapid drop in
the 5 Day Average of the Put to Call Ratio will lead to a repeat performance of
what has occurred in the past however it certainly shouldn't be
ignored. 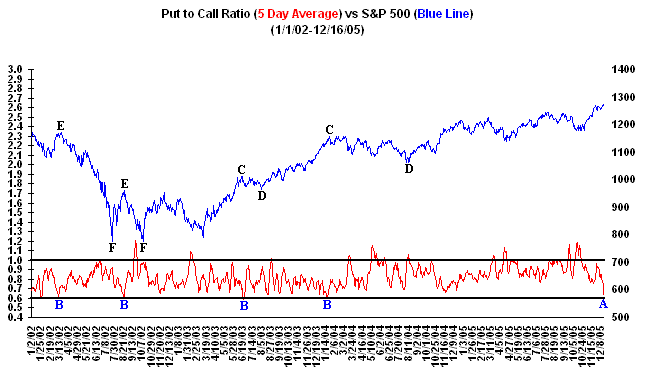
As far as the major averages the Dow
so far has been able to hold support just above the 10700 level during the past
three weeks which corresponds to its previous resistance level and rising 10 Weekly EMA
(blue line). The question at this point is can the Dow break above its
previous early March high near 11000 (point G) or will it eventually drop below
its 10700 support level? 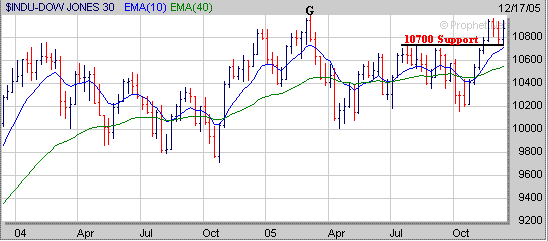
If the Dow fails to break above its
early March high near 11000 and breaks below its 10700 support level then I
would expect a drop back to its 40 Weekly EMA near 10550. Meanwhile if the
Dow is able to rise above the 11000 then its next area of upside resistance
would be where it stalled out at in 2001 near 10400 (point H). 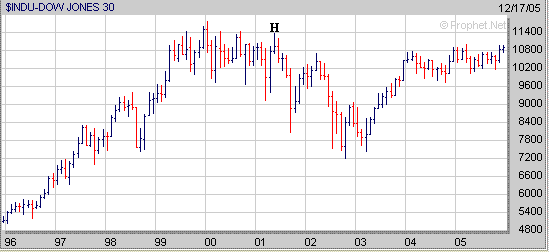
The Nasdaq has been holding support
above the 2220 area during the past three weeks while encountering resistance
just below 2280. Just like the Dow the question is will the Nasdaq break
out of this consolidation pattern to the downside or upside in the weeks ahead? 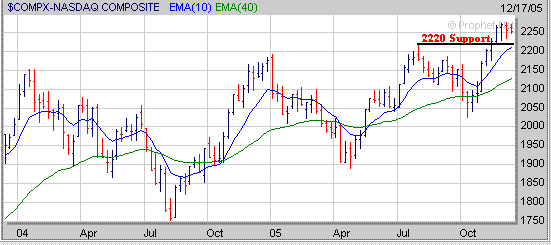
If the
Nasdaq is unable to break above the 2280 area and eventually drops below the
2220 level then its next level of support would be at its 40 Weekly EMA (green
line) near 2125. Meanwhile if the Nasdaq is able to rise above the 2280
level then it may encounter upside resistance in the 2330-2350 range which is where it
stalled out in May of 2001 (point I) after bouncing from oversold
conditions. 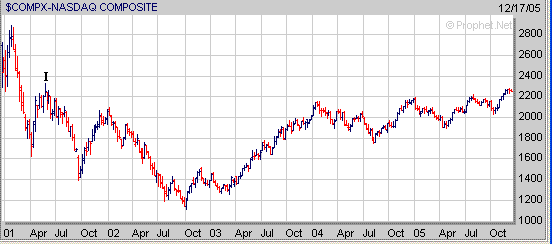
As far as the S&P 500 it has
been holding support near the 1245 level during the past three weeks which
coincides with its early August high and rising 10 Weekly EMA (blue line). 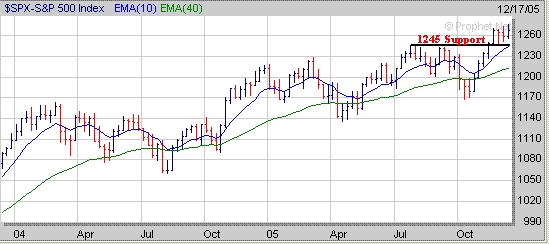
If the S&P 500 trends higher in
the near term its next level of upside resistance could be around the 1315 area which is where it
stalled out at in May of 2001 (point J) after bouncing from oversold
conditions. Meanwhile if the S&P 500 fails to trend higher over the
next few weeks and eventually comes under some selling pressure and breaks below the
1245 support area look for support at its 40 Weekly EMA (green line) near
1215. 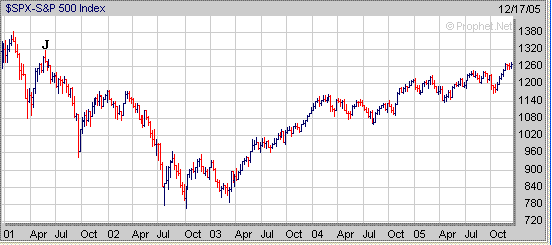
As mentioned in the beginning the
very low reading in the 5 Day Average of the Put to Call Ratio is somewhat
concerning. However the week before and after Christmas historically can
be a strong one for for the market so if some selling pressure were to
develop I would expect it to occur in early January. For the year our Long Term
Investing Strategy is up 32% while our Short Term Investing
Strategy is up 64%.
Signup today for a "Free"
2 Week Trial Membership to amateur-investor.net and have access to
our current Stocks to Watch Buy List which contains stocks that are currently developing a favorable chart
pattern which can be used with either our Long Term
Investing Strategy or Short Term Investing
Strategy.
Also you will have access to these other investment products.
Daily Breakout Reports
Market Timing Indicator
Weekly ETF Buy and Short Signals
Click
Here to Signup for a "Free" 2 Week Trial Membership
Send this Free Newsletter to a Friend or Relative
Amateur-Investor.net
|


