|
Click
Here to Signup for a Premium Membership and save 50%
which includes our Stocks to Watch List and Daily Breakout Reports
(Please note our 50% Off Special will end on January
1st)
Weekend Stock Market Analysis
(12/18/04)
There are two weeks left until the end of the year and we shall see if the
anticipated Christmas Rally materializes or not. The Dow so far hasn't been
able to break out of its longer term trading range which began last
February. One of two scenarios are possible as we end this year and then
move into the early part of 2005. Either the Dow will break strongly above
the top of its trading range near 10750 and attempt to rally up to the 11200 to
11300 range which was the high made in 2001 (point A) or it will stall out near
10750 and then eventually sell off which could lead to a retest of its 2004 low
near 9700 at some point in 2005. 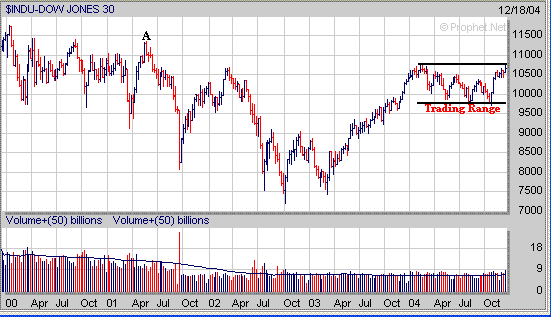 The Nasdaq is at the top of its
longer term trading range which began last January. As with the Dow there
are two possible scenarios to watch for in the weeks ahead. The first
scenario would be for the Nasdaq to break out of its longer term trading range
to the upside leading to a possible rally up to its April 2001 level near 2300
(point B). Meanwhile the second scenario would be for the Nasdaq to stall
out near the top of its trading range and then eventually sell off leading to a
retest of its 2004 low near 1750 at some point in 2005. 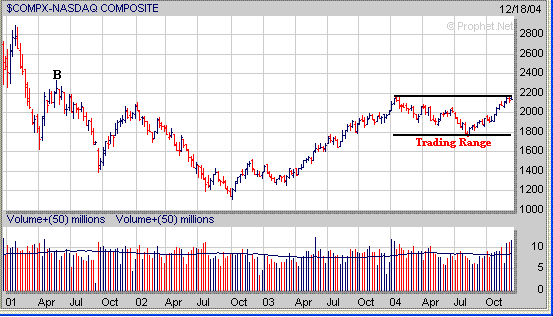
Meanwhile the S&P 500 has already
attempted to break out of its longer term trading range. If the S&P
500 rallies into the end of the year and through the early part of 2005 it has a
significant area of upside resistance near 1255 (point C) which is at its longer
term 61.8% Extension Level (calculated from the 2000 high to the 2002
low). Meanwhile if the S&P 500 begins to stall out over the next week
or two and begins to sell off then its first area of support would be at the top
of its prior trading range near 1160. 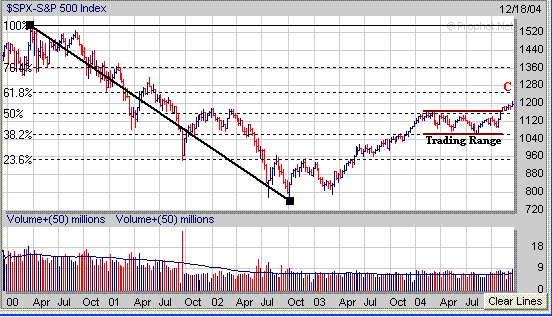
At this point it's not clear which
of the above scenarios could occur in the weeks ahead. One thing that is
a little bothersome is the amount of complacency and excessive Bullishness that
has developed among the investment community based on some of the Contrarian
Indicators. Currently the % of Bullish Investment Advisors as polled by
Investors Intelligence has risen above 60% (point D) as shown by the chart
below. Also you can see since 1997 it has been somewhat of a rare occurrence
for the % of Bullish Investment Advisors to rise above 60% (points E, F, G, H
and I). The last two times the % of Bullish Investment Advisors
rose above 60% was last Winter (point E) and back in the Summer of 2003 (point
F). As the % of Bullish Investment Advisors reached 60% last March
(point E) the S&P 500 peaked as well which led to a correction that lasted
until August (points J to K). Meanwhile when the % of Bullish Investment
Advisors reached 60% in the Summer of 2003 (point F) the S&P 500 didn't go
through much of a correction and traded sideways for a few months (point L)
before heading higher. This it will be interesting to see whether the
S&P 500 will eventually go through a sustained correction like happened earlier this year or whether it will begin to trade sideways like occurred in
the Summer of 2003. 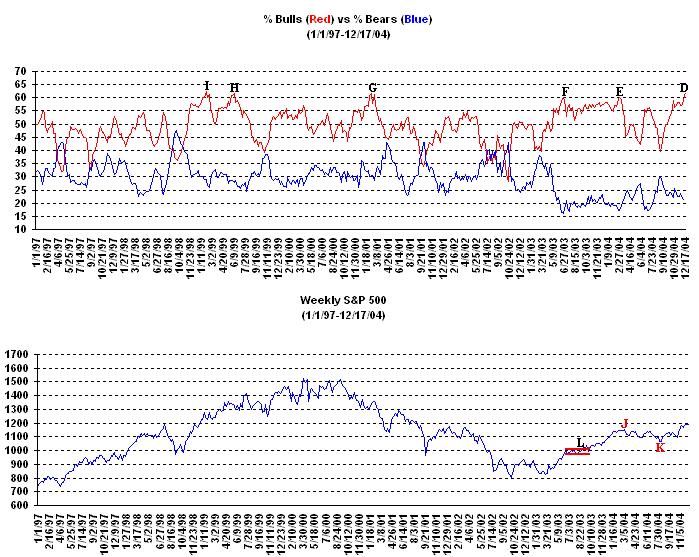
Looking at some sectors the price of
Crude Oil found support at its 200 Day EMA (purple line) and rallied strongly
this past week and has risen back to its 50 Day EMA (blue line) just above
46. If the price of Crude Oil continues to rally I would look for it to
encounter significant upside resistance in the 48 to 49.50 range which is where
its 50% (point M) and 61.8% (point N) Retracement Levels (calculated from the
October high to the December low) come into play at. 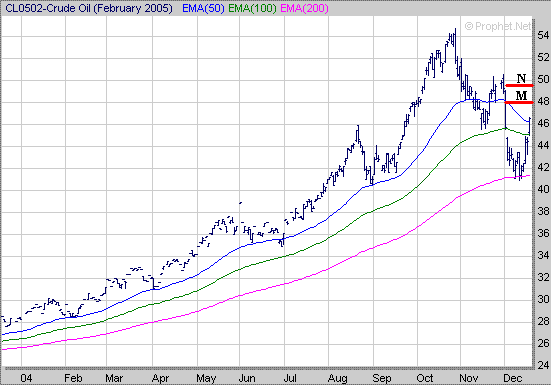
Meanwhile the Banking sector (BKX)
is still exhibiting a "Cup and Handle" pattern as it has developed a 5
week Handle (H). If the BKX can break strongly above the 104 level this
would be a good sign for the S&P 500 as the Banks are heavily weighted in
the S&P 500. However on the flip side if the BKX breaks strongly below
the bottom of its Handle near 100.50 then this wouldn't be a good sign for the
S&P 500. 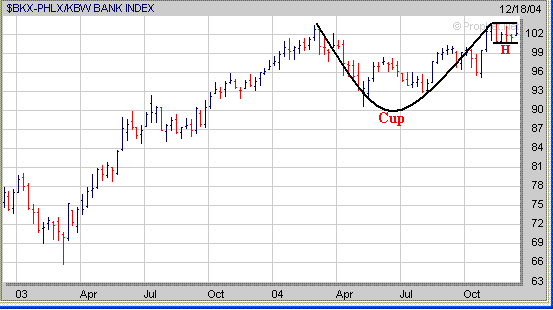
As far as the Semiconductors the
Semiconductor Holders (SMH) ran into upside resistance this week near their 200
Day EMA (purple line). The key support level to watch next week in the
SMH's is around 32 which is where its upward sloping trend line originating from
the early September low (solid brown line) and 23.6% Extension Level (calculated
from the January high to the September low) reside at. If the SMH's break strongly below the 32 level this would likely lead to an eventual retest of the
September low near 28 and have an adverse affect on the Nasdaq as well. 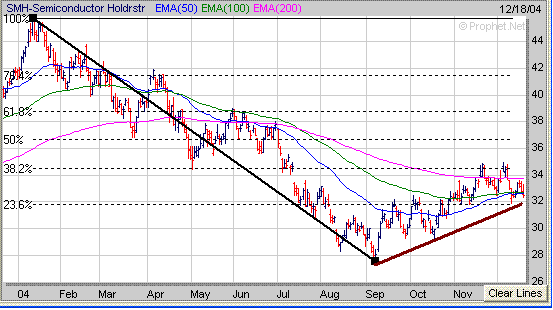
Finally
when investing in stocks sometimes it requires a lot of patience and you have to
wait for those opportunities to develop. NATR is an excellent example of a
stock we followed for several months before it broke out in November.
Notice how NATR formed a "Cup" from June of 2002 until May of
2004. After forming the right side of a "Cup" NATR then
developed a "Handle" over the next 6 months before finally breaking
out this November. Even though it was frustrating for me to have
to wait 6 months before NATR finally broke out having the patience to keep
following it rewarded me and other investors who didn't give up on it as
well. 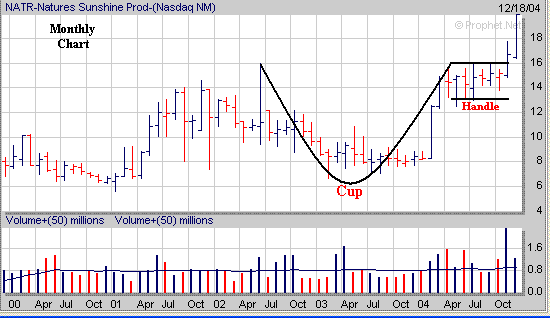
Signup today for a 2
Week Trial Membership and have access to our Stocks
to Watch List which provides a list of Stocks that are exhibiting a
favorable Chart Pattern such as the "Cup and Handle". Also you
will receive our Daily Breakout Report
by email which Alerts you to Stocks that
are breaking out of a favorable Chart Pattern from our Stocks
to Watch List.
Click
Here to signup for a "Free" 2 Week Trial Membership
Amateur-Investor.net
|


