|
Weekend Stock Market Analysis
(12/24/05)
Since late November the major averages have basically been in a
consolidation mode after rallying strongly from mid October through the latter
half of November. Investors have become pretty complacent recently with the 5 Day Average of the Put to Call
Ratio dropping to a very low level just over a week ago. 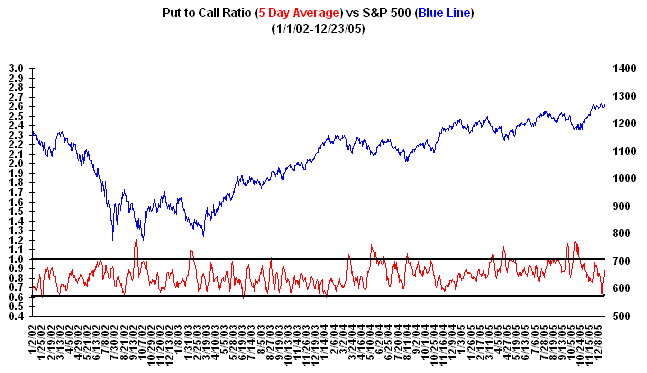
In addition looking at the weekly chart of the Volatility Index (VIX)
also shows complacency among investors as the VIX closed the week near the low
made in July. Keep in mind during the past few years when the VIX has
dropped considerably (points A to B) after making a strong upward move the S&P 500 has
usually gone through a correction (points C to D) shortly thereafter. Since mid October the VIX has dropped from around 17 back down to near a value
of 10 (points E to F) and looks rather similar to what occurred from mid April
through early July and in 2004 from mid October through late December (points G to H). The question is
can the S&P 500 make another significant move higher with the lastest VIX
reading near a 52 week low? Based on what has occurred during the past two
years it appears that the S&P 500 may have a difficult time making a
substantial move higher as we move into the early part of 2006 and may undergo
some type of multi-week correction at some point possibly like we saw in the
Summer or earlier in the year (points I to J). 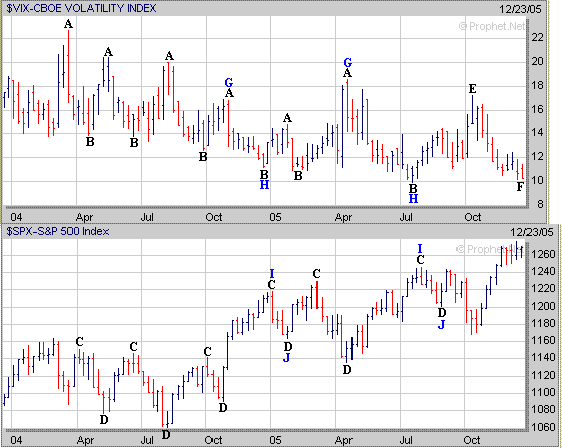 As far as the major
averages the Dow has been in a consolidation pattern during the past four weeks
and has encountered upside resistance just below its early March high near 10960
but found support just above 10700 which coincides with its 10 Weekly EMA (blue
line) and previous resistance area in the Summer. At this point
one of two things may occur as we move into 2006. If the Dow fails to
break above the 10960 resistance area and eventually breaks below its 10700
support area then I would expect a drop back to its 40 Weekly EMA (green line)
near 10550. 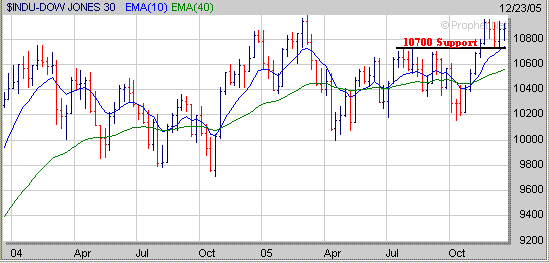
Meanwhile if the
Dow is able to break strongly above the 10960 level then this could lead to a
move up to where the Dow stalled out in 2001 near 11400 (point K). 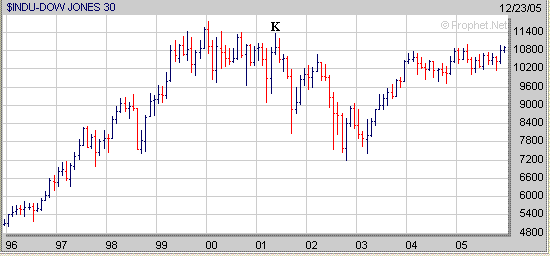
As for the Nasdaq
it found support early in the week at its 10 Weekly EMA (blue line) near 2220
and then rallied. However the Nasdaq still has an upside resistance area
to contend with near 2280. Over the next few weeks if the Nasdaq is unable
to rise above its previous upside resistance area near 2280 and then breaks
below its 10 Weekly EMA then I would expect it to eventually drop back to its 40
Weekly EMA (green line) near 2130. 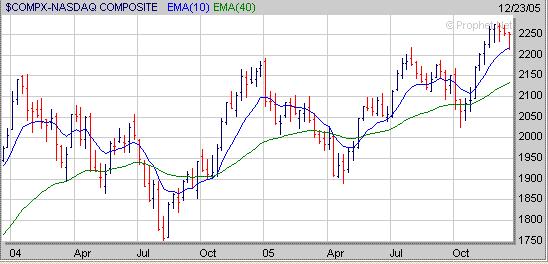
Meanwhile
if the Nasdaq is able to hold support near its 10 Weekly EMA and eventually can
rise above the 2280 area then its next area of upside resistance may occur
somewhere in the 2350 to 2400 range (point L). The 2350 to 2400 area is
where the Nasdaq stalled out at in May of 2001 after attempting to bounce from
oversold conditions. 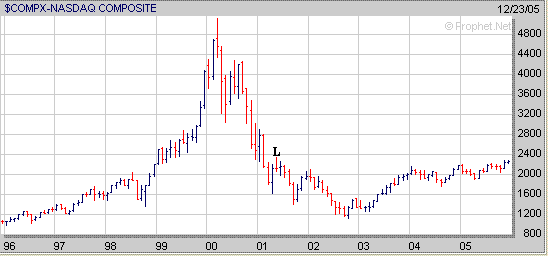
The S&P 500 so
far has held support near 1245 during the past four weeks which coincides with
its 10 Weekly EMA (blue line) and previous upside resistance area that occurred
in the Summer. If the S&P 500 eventually comes under some selling
pressure as we move into 2006 and breaks below the 1245 level then it may drop
back to its 40 Weekly EMA (green line) near 1215. 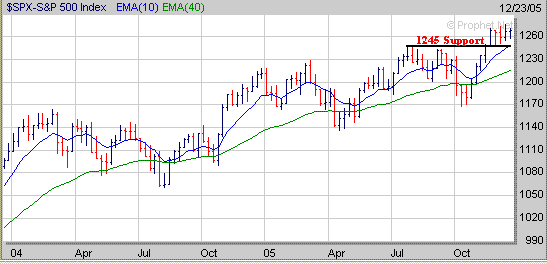
Meanwhile if the
S&P 500 begins to trend higher again as we move into 2006 then its next area
of upside resistance would probably occur in the 1315 to 1360 range. The
1315 area is where the S&P 500 stalled out at in May of 2001 (point M) after
bouncing from oversold conditions while the 1360 level corresponds to the
S&P 500's longer term 76.4% Retracement Level (point N). 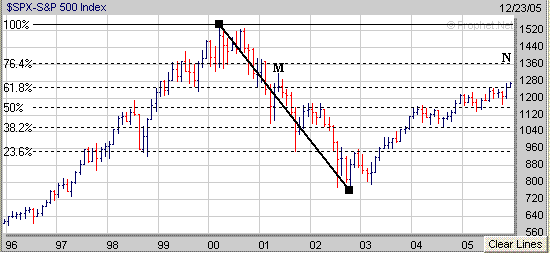
As I mentioned in
the beginning the big question is will the S&P 500 be able to make another
substantial move higher as we move into the early part of 2006 with the
Volatility Index (VIX) near a 52 week low once again? Finally
when looking for stocks to invest in focus on those that have good Sales
and Earnings Growth which are forming a favorable chart pattern such as the Cup
and Handle or Double Bottom. A stock which recently formed the
right side of a longer term Cup is NMR. Over the next few weeks NMR needs
to develop a constructive Handle to complete a Cup and Handle pattern. 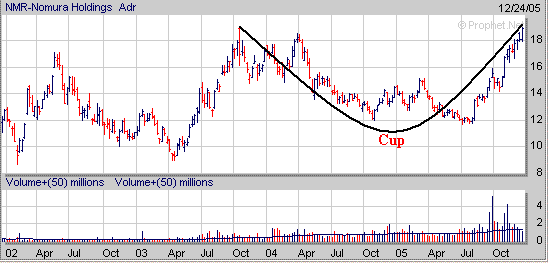
Meanwhile
XTO has formed a Double Bottom pattern (looks like the letter W) the past few
months and also needs to work on developing a constructive Handle during the
next few weeks. 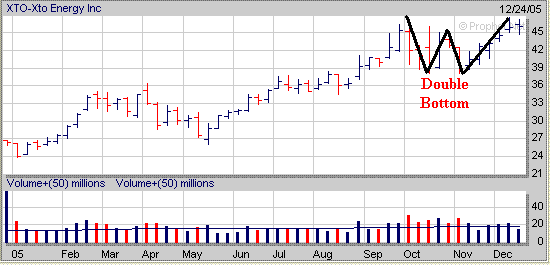
As I have mentioned before its
important for a stock to develop a proper Handle after forming a Cup or Double
Bottom pattern as they have a higher success rate of following through to the
upside. For the year our Long Term
Investing Strategy is up 32% while our Short Term Investing
Strategy is up 64%.
Signup today for a "Free"
2 Week Trial Membership to amateur-investor.net and have access to
our current Stocks to Watch Buy List which contains stocks that are currently developing a favorable chart
pattern which can be used with either our Long Term
Investing Strategy or Short Term Investing
Strategy.
Also you will have access to these other investment products.
Daily Breakout Reports
Market Timing Indicator
Weekly ETF Buy and Short Signals
Click
Here to Signup for a "Free" 2 Week Trial Membership
Send this Free Newsletter to a Friend or Relative
Amateur-Investor.net
|


