|
Our 50% Off Special will end on January
1st
Click
Here to Signup for a Premium Membership and save 50%
which includes our Stocks to Watch List and Daily Breakout Reports
Weekend Stock Market Analysis
(12/25/04)
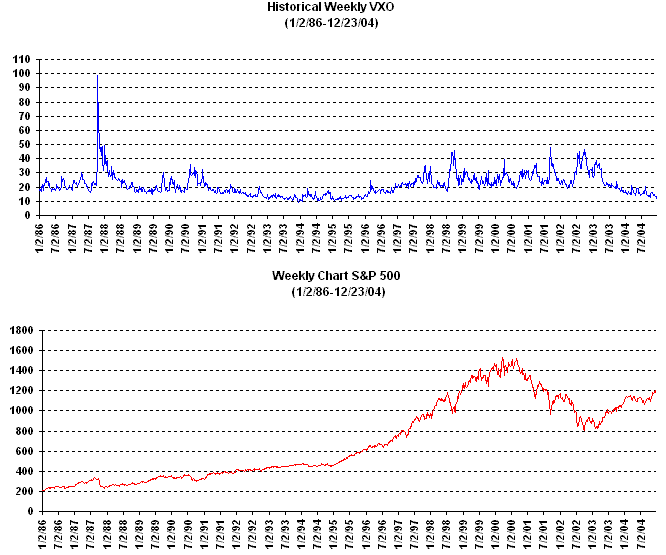
Over the past several weeks the Volatility Indices which track
the S&P 100 (VXO) and S&P 500 (VIX) have continued their downward trends
and are nearing historic lows which were made in the mid 1990's. The VXO
started in 1986 and a longer term weekly chart is shown below.
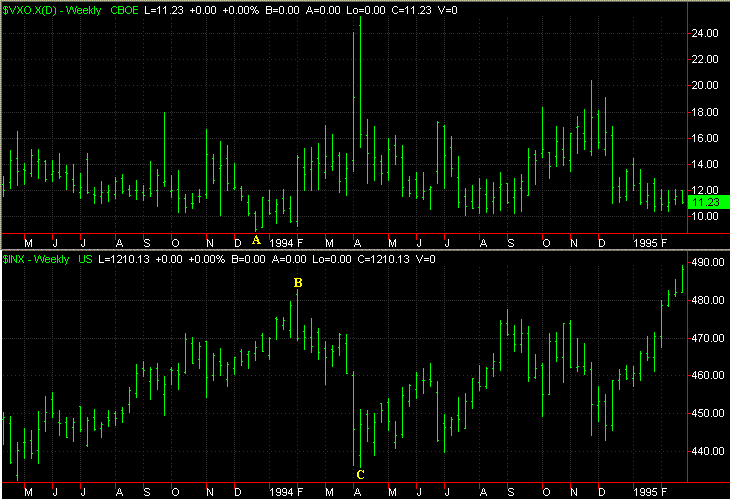
Zooming in on the period in the mid 1990's gives us the
following weekly chart comparing the VXO to the S&P 500. As you can
see the VXO dropped below 10 in December of 1993 (point A) however the S&P
500 continued higher through late January of 1994 before topping out (point
B). This was then followed by a 10% correction that lasted about 2 1/2
months before a bottom was made in early April of 1994 (points B to C). Thus the question is with
the current readings in the VIX and VXO approaching historical lows will we see
a substantial correction develop beginning in late January or early
February of 2005 much like occurred in the early part of 1994?
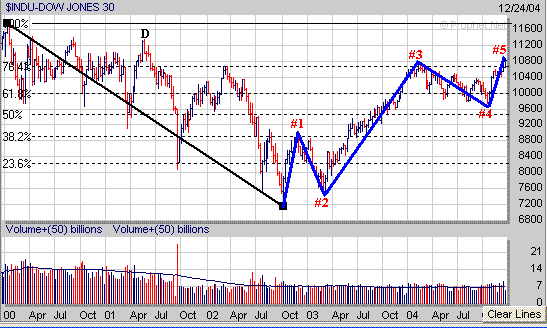
Meanwhile as I have mentioned before all three major averages
appear to be exhibiting an Elliot 5 Wave Pattern and currently look to be going
through their final upward wave.
The Dow which had been encountering upside resistance at its
longer term 76.4% Extension Level (calculated from the 2000 high to the 2002
low) near 10750 finally broken above it this past week. If the Dow
continues to move upward in association with its final 5th Wave through January
of 2005 it appears that its next level of upside resistance would be in the
11200 to 11300 range which corresponds to its 2001 high (point D).
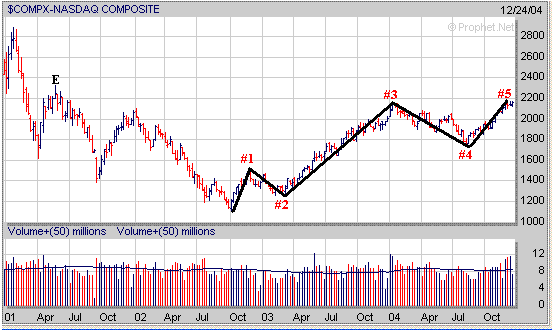
Meanwhile the Nasdaq is also potentially exhibiting the final
upward wave in association with its longer term 5 Wave Pattern. If the
Nasdaq can break solidly above 2170 and continues higher through January of 2005
its next level of upside resistance would probably be in the 2250 to 2300 range
which is where it stalled out at in May of 2001 (point E).
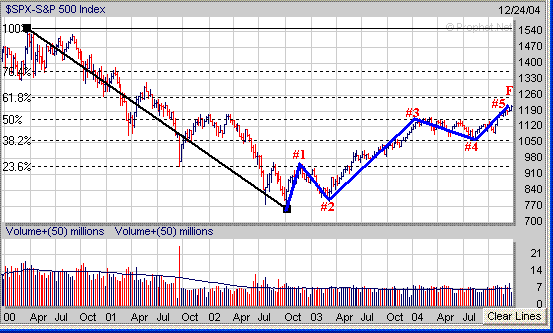
As far as the S&P 500 it continues to slowly advance upward
after breaking through its longer term 50% Extension Level (calculated from the
2000 high to the 2002 low) near 1160 and also appears to be exhibiting a 5 Wave
Pattern as well. If the S&P 500 continues to rally through January of
2005 its next significant area of upside resistance is around 1255 which
coincides with its longer term 61.8% Extension Level (point F).
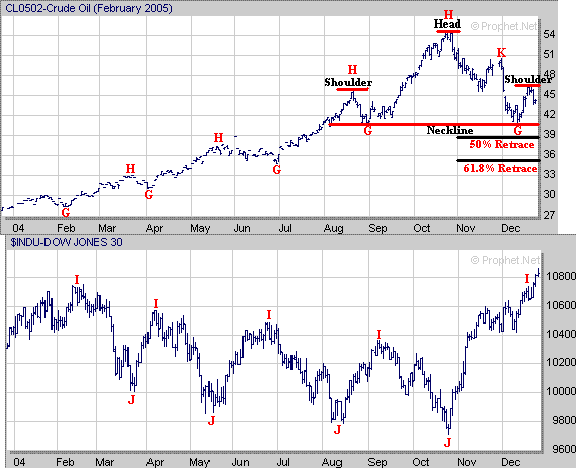
Over the past few months it appears the sell off in the price of Crude Oil
has been a major catalyst to propel the market higher. As I have mentioned
before the price of Crude Oil and the Dow have been going in opposite directions
during the past year. When the price of Crude Oil has risen substantially
(points G to H) the Dow has sold off (points I to J) and when the price of Crude
Oil has sold off (points H to G) the Dow has rallied strongly (points J to I).
Currently it appears the price of Crude Oil could be developing
a Head and Shoulders Top pattern with a key support area at its Neckline around
40.50. Further action in the major averages could be affected by what the
price of Crude Oil does in the weeks ahead. If the price of Crude Oil
breaks below the 40.50 level this would probably have a positive affect on the
major averages and lead to a drop back to the mid to upper 30s which is where
Crude Oil's longer term 50% and 61.8% Retracement Levels come into play
at. Meanwhile Crude Oil currently has an upside resistance area at its 2nd
Shoulder near 46.50 and if this level is taken out to the upside then Crude Oil could rally up
to around 50 or so (point K) which might have a negative affect on the major
averages.
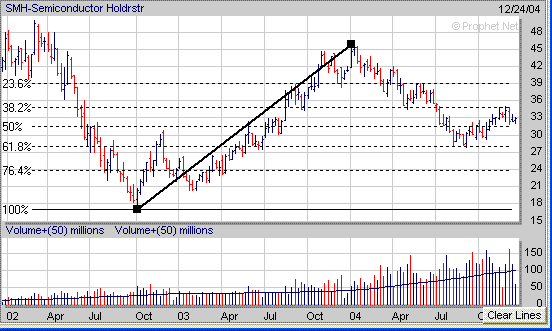
Meanwhile looking at a few other sectors the Semiconductor
Holders (SMH) which found support last Summer at their 61.8% Retracement Level
(calculated from the 2002 low to the early 2004 high) near 28 have been
encountering resistance at their 38.2% Retracement Level near 35 while holding
support around their 50% Extension Level near 32. Right now it appears
there are two possible scenarios for the SMH's which will have an impact on the
Nasdaq. The first scenario would be for the SMH's to break above the 35
level and rally up to the 39 area (23.6% Retracement level) which would have a
positive affect on the Nasdaq. Meanwhile the second scenario would be for
the SMH's to break below the 32 level leading to a drop back to the 28 level
(61.8% Retracement level) which would have a negative affect on the Nasdaq.
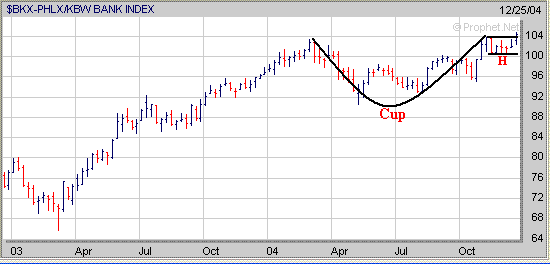
The Banking Index (BKX) is attempting to break out of its 6 week
Handle (H) after forming a Cup. If the BKX can follow through to the
upside this would have a positive affect on the S&P 500 which is heavily
weighted by the Banks.
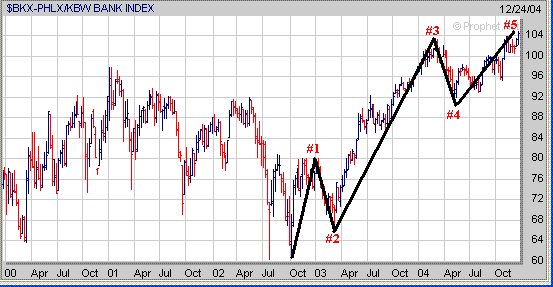
However looking at a longer term 5 year chart of the BKX shows that it
may be exhibiting the final upward wave in association with a longer term 5 Wave
Pattern just like the major averages.
If the major averages can maintain their rally into the early
part of 2005 continue to focus on those stocks which have developed a favorable
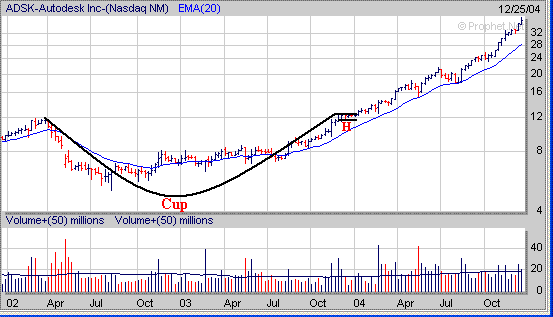
chart pattern. ADSK formed a "Cup and Handle" from 2002 through
2003 before breaking out in early 2004 and has been in a steady up trend the entire
year while holding support at its 20 Weekly EMA (blue line) on each pullback.
Signup today for a 2
Week Trial Membership and have access to our Stocks
to Watch List which provides a list of Stocks that are exhibiting a
favorable Chart Pattern such as the "Cup and Handle". Also you
will receive our Daily Breakout Report
by email which Alerts you to Stocks that
are breaking out of a favorable Chart Pattern from our Stocks
to Watch List.
Click
Here to signup for a "Free" 2 Week Trial Membership
Amateur-Investor.net
|


