|
Weekend Stock Market Analysis
(12/31/05)
The major averages were rather flat in 2005 with the Dow ending
down 0.6% while the Nasdaq and S&P 500
had small gains of 1.6% and 3.0%
respectively. The month of December was disappointing
as historically it has performed well in the past however the major averages
basically remained in a choppy trading range after performing well from mid
October through late November. It appears many investors thought the
market was going to continue higher into the end of the year as some of the
Contrarian Indicators were signaling a substantial amount of complacency among
investors. If you remember I mentioned the 5 Day Average of the
Put to Call Ratio dropped considerably earlier in the month (point A). In
the past when the 5 Day Average of the Put to Call Ratio has dropped to around
0.60 (points B) this has eventually led to a correction in the S&P 500
(points C to D). 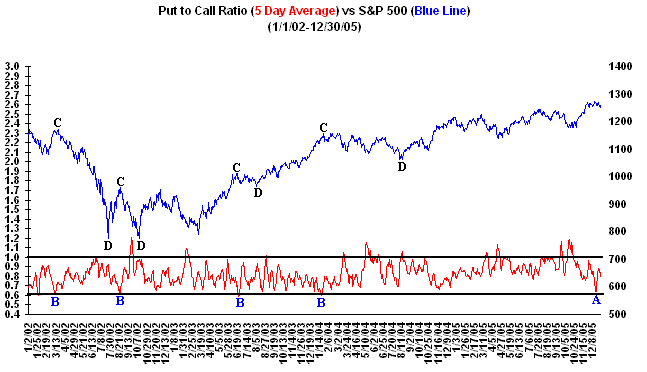
Meanwhile the Volatility Index (VIX)
had dropped back to a very low level (point E) near its previous 52 week low
made in July. As we have seen in the past when the VIX has dropped
considerably and approached a new 52 week low (points F to G) the S&P 500
usually has gone through a correction shortly thereafter (points H to I). 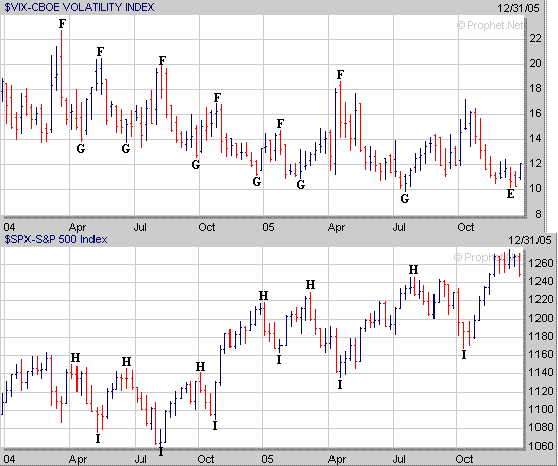
Finally the % of Bullish Investment
Advisors has risen up to 60% (point J). The last time the % of Bullish
Investment Advisors was this high was early in the year (point K) which was then
followed by a correction in the S&P 500 (point L to M). 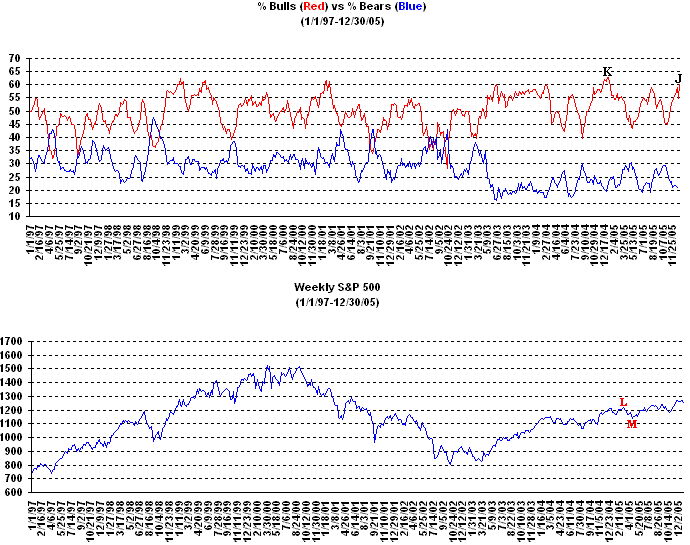
Based on the Contrarian Indicators
shown above it appears a lot of investors thought the market was going to
continue higher to end the year. However as we have seen in the past when
everyone believes the market will go higher usually the exact opposite happens. As
far as the major averages next week is going to be interesting as they are near
important support levels. The Dow has dropped back to its 50 Day EMA (blue
line) just above 10700 and one of two things may occur in the early part
of 2006. Either the Dow will hold support near 10700 and then
attempt to rally or it will break below the 10700 leading to a drop back to its
200 Day EMA (green line) near 10560. 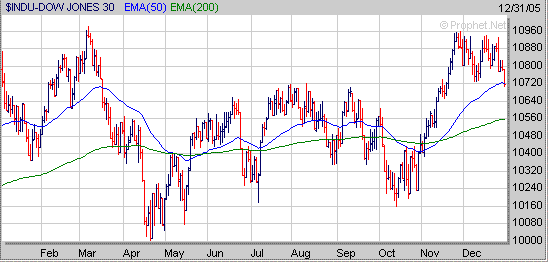
Meanwhile
the Nasdaq closed just below its 50 Day EMA (blue level) on Friday just above
the 2200 level. It's going to be very important for the Nasdaq to hold support
next week above the 2200 level. If the Nasdaq is unable to hold support
above the 2200 level and comes under more selling pressure then its next level
of support would be at its 200 Day EMA (green line) near 2130. 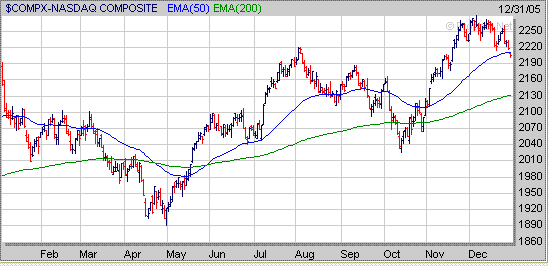
The
S&P 500 has dropped back to its 50 Day EMA (blue line) near 1245 an closed
just above it on Friday. Thus it will be important for the S&P 500 to
hold support near the 1245 level next week. If the S&P 500 is unable
to hold support near the 1245 level and comes under more selling pressure then
its next level of support would be at its 200 Day EMA (green line) near
1215. 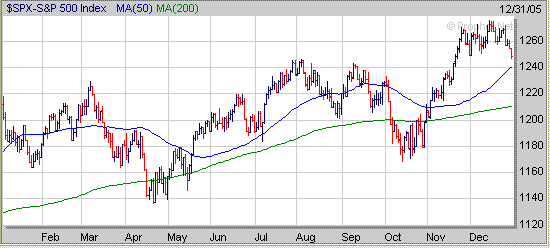
As
far as what will happen in 2006 that is hard to say and may depend on several
things such as the future price of Crude Oil and what Interest Rates do in the
longer term. Meanwhile as is the case every year some stocks will do well
while others won't. Even though the market was rather flat in 2005 some
stocks still did well. I still believe the best stocks to invest
in are those that are breaking out of a favorable chart pattern which are
experiencing decent Sales and Earnings Growth. The most common chart
pattern to look for is the Cup and Handle. GMXR is a stock which formed a
longer term Cup and Handle pattern and broke out this Summer leading to an
eventual gain over 200%. 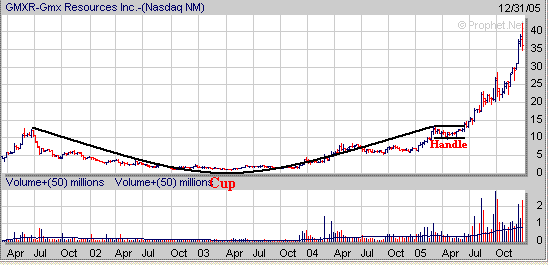
Meanwhile another chart pattern to
look for is the Flat Base. IFO developed a 3 month Flat Base from August
through October and then broke out in November leading to an eventual gain over
250%. 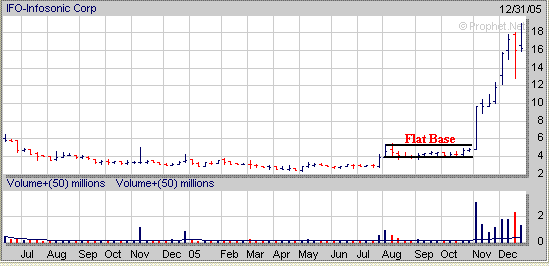
For 2005 our Long Term Investing Strategy finished up 31% while
our Short Term Investing Strategy ended up 64%.
Signup today for a "Free"
2 Week Trial Membership to amateur-investor.net and have access to
our current Stocks to Watch Buy List which contains stocks that are currently developing a favorable chart
pattern such as the Cup and Handle or Flat Base which can be used with either our Long Term
Investing Strategy or Short Term Investing
Strategy.
Also you will have access to these other investment products.
Daily Breakout Reports
Market Timing Indicator
Weekly ETF Buy and Short Signals
Click
Here to Signup for a "Free" 2 Week Trial Membership
Send this Free Newsletter to a Friend or Relative
Amateur-Investor.net
|


