|
Signup
today for a Premium Membership and save 50%
which includes our Stocks to Watch List and Daily Breakout Reports
Weekend Stock Market Analysis
(12/4/04)
The big sell off in the price of Crude Oil this week helped the
major averages rally. However Crude Oil is approaching a major support
level just below $42 which is at its 200 Day EMA (purple line) and is near its
upward sloping trend line (solid black line). Thus we could see an
oversold bounce occur in the price of Crude Oil next week which could lead to
some selling pressure in the major averages. Remember
during the past year the price of Crude Oil and the Dow have been going in
opposite directions. When the price of Crude Oil has rallied (points A to
B) the Dow has come under selling pressure (points C to D) and when the price of
Crude Oil has fallen (points B to A) the Dow has rallied (points D to C). 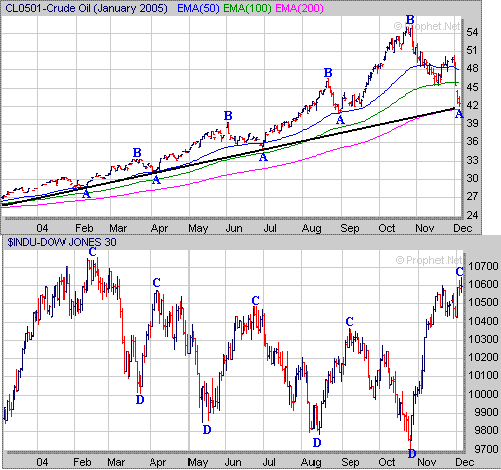
As far as the major averages the Dow
still remains in a longer term trading range that began last February when it
peaked around 10750 (point E). In the longer term if the Dow can break
solidly above 10750 then this could lead to a move up to the 2001 high near
11300 (point F). However in order for this to happen the price of Crude
Oil may have to break strongly below the $42 level in the weeks ahead. 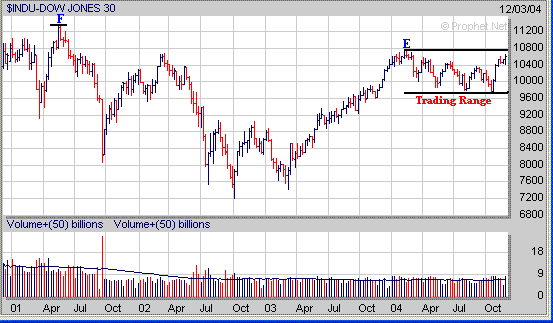
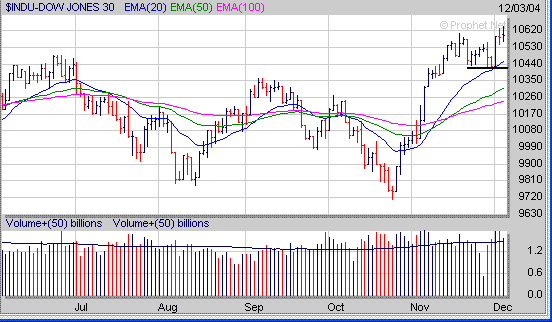
In the near term if we do see an
oversold bounce occur in the price of Crude Oil and some selling pressure
develops the Dow should find initial support in the 10400 to 10450 range which
corresponds to its November low and rising 20 Day EMA (blue line).
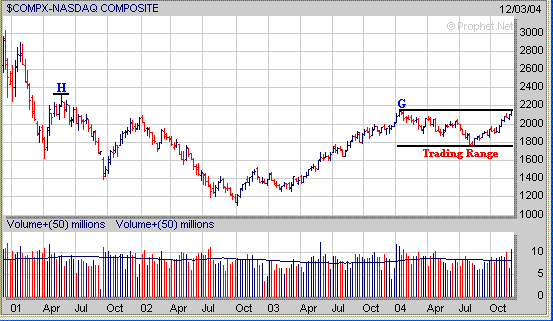
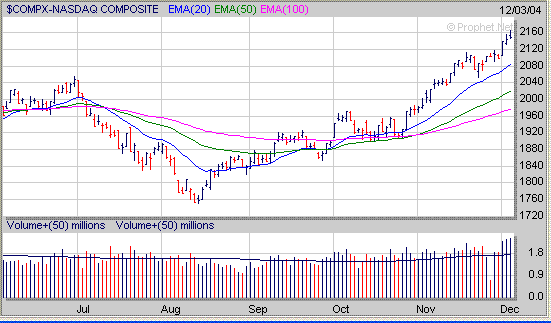
As far as the Nasdaq it has been in a trading range this year
between 1750 and 2150 and has rallied back to where it was when it peaked in
late January (point G). If the Nasdaq can break strongly to the upside out
of this trading range in the weeks ahead then it could potentially rally up to
the April 2001 high near 2300 (point H) which may act as the next significant
level of upside resistance.
Meanwhile since breaking out in late October the Nasdaq has been
holding support above its 20 Day EMA (blue line). If some selling pressure
does develop in the near term I would look for the Nasdaq to hold support at or
above its rising 20 Day EMA which is currently just above 2080.
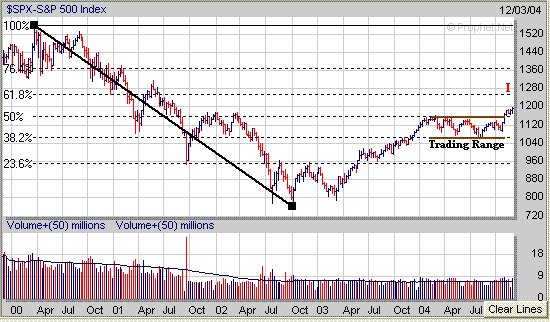
The S&P 500 which had been stuck in a trading range between
its longer term 38.2% and 50% Extensions Levels (calculated from the 2000 high
to the October 2002 low) broke out in early November. If the S&P 500
can follow through in the weeks ahead its next significant area of upside
resistance resides at its 61.8% Extension Level near 1255 (point I).
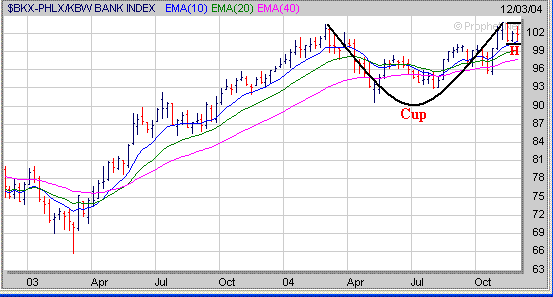
In addition a key sector to watch is the Banks (BKX) which are
weighted heavily in the S&P 500. Currently the BKX appears to be
developing a "Cup and Handle" pattern. If the BKX can break
above the 104 level in the weeks ahead this would be a good sign for the S&P
500 and probably allow the S&P 500 to test the 1255 level.
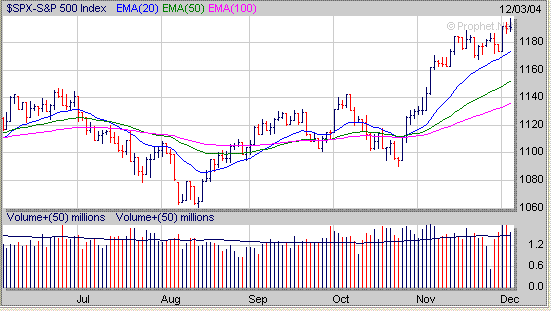
In the near the S&P 500 has been holding support above its
rising 20 Day EMA (blue line) since late October while remaining in an up
trend. If some selling pressure does develop in the near term look for
support at the S&P 500's 20 Day EMA which is currently around
1173.
Some of you have asked when do you start to consider locking
profits after a stock has broken out of a favorable chart pattern such as the
"Cup and Handle". One guide you can use once a stock has
broken above its Pivot Point is placing a Trailing Stop just below its 10 Weekly
EMA on a Weekly Chart or the 50 Day EMA on a Daily Chart to lock in profits once
a stock potentially begins to breakdown.
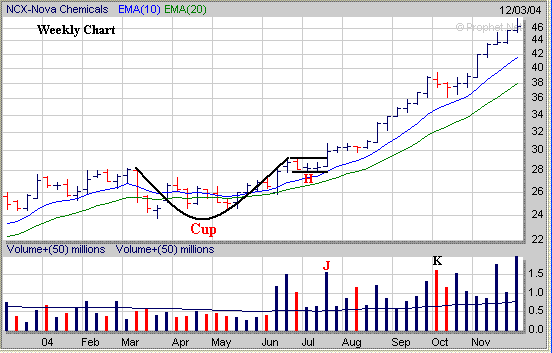
NCX is a recent example of a stock in our Top 100 List which
broke out of a "Cup and Handle" pattern last July accompanied by
strong volume (point J) and has been trending higher for several
weeks. In the case of NCX as you can see below it has remained
above its rising 10 Weekly EMA (blue line) while trending higher over the past
several weeks. Also it did pullback some in October on heavier volume
(point K) as some selling pressure developed however as you can see it held
support above its 10 Weekly EMA.
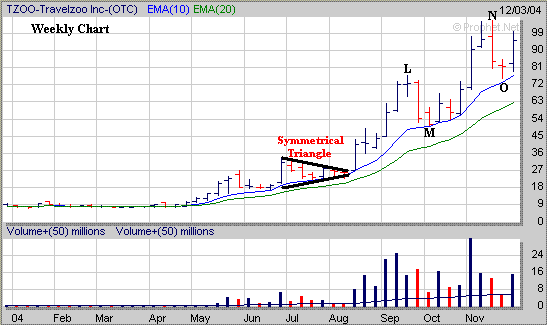
Another example of a stock which broke out of a
"Symmetrical Triangle" pattern last August was TZOO. Notice how
it has been finding support at its 10 Weekly EMA (blue line) while remaining in
an up trend over the past several weeks. Although the pullbacks in late
September (points L to M) and mid November (points N to O) were dramatic TZOO
still held support at its 10 Day EMA.
Signup today for a 2
Week Trial Membership and have access to our Stocks
to Watch List which provides a list of Stocks that are exhibiting a favorable Chart
Pattern such as the "Cup and Handle". Also you will receive our Daily Breakout Report
by email which Alerts you to Stocks
that are breaking out of a favorable Chart Pattern from our Stocks
to Watch List.
Click
Here to signup for a "Free" 2 Week Trial Membership
Amateur-Investor.net
|


