|
Click
Here to Signup for a Free Trial Membership and have access to
our Stocks to Watch List and Daily Breakout Reports
Weekend Stock Market Analysis
(2/12/05)
The major averages continue to rally off their late January lows
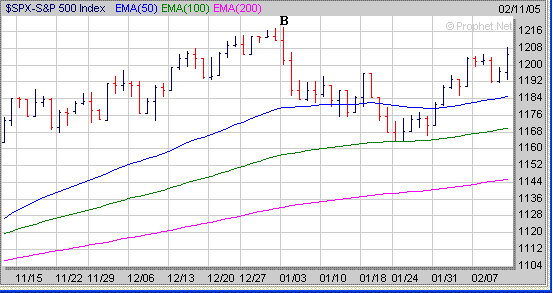
as both the Dow and S&P 500 are within striking distance of their early January highs. The Dow is only about
70 points away from
its early January intra day high near 10870 (point A) while the S&P 500 is
around 12 points from its intra day high (point B). 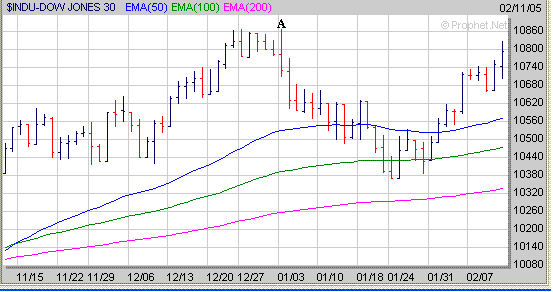
The current chart pattern of the
S&P 500 looks similar to what occurred from last Summer into early Fall
although on a smaller timescale. Thus if the S&P 500 does reach its
early January high near 1217 it will be interesting to see if this is followed
by a quick sell off like occurred last October (points C to D). 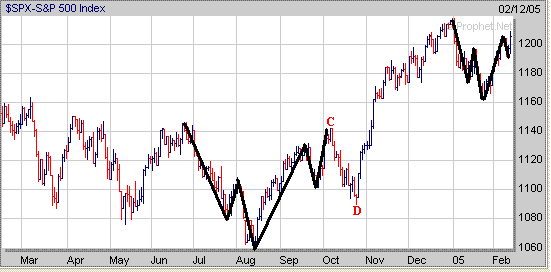
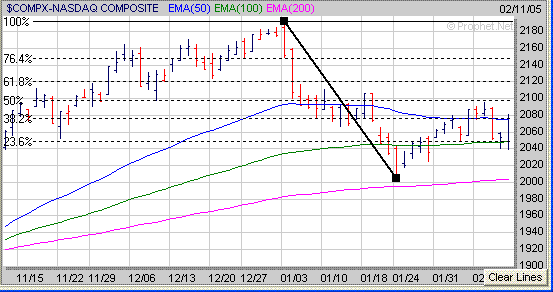
Meanwhile the Nasdaq has been having a more difficult time
rallying although it did do well on Friday. If the Nasdaq does try and
move higher I would look for resistance to occur in the 2100 to 2120 area which
corresponds to its 50% and 61.8% Extension Levels (calculated from the early
January high to its late January low).
If the
Nasdaq is going to continue higher a lot may depend on what the Semiconductors
do. The Semiconductor Holders (SMH) were up strongly this week however they are
nearing a previous upside resistance area near 34.50 (point E) which coincides
with their longer term 38.2% Extension Level (calculated from their early
January 2004 high to their September 2004 low). It's going to be
interesting to see if the SMH's stall out again near 34.50 or whether they can
break above 34.50 leading to a stronger move up to their 50% Extension Level
near 37 (point F). If the SMH's break strongly above 34.50 then this will
have a positive affect on the Nasdaq and probably allow it to reach the 2120
area as mentioned above. 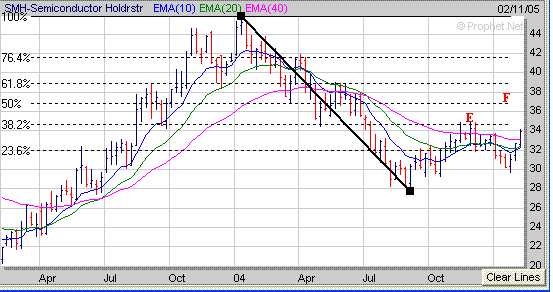
Meanwhile I'm also
watching the price of Crude Oil for either a rise above the 50 level (resistance
area) or a drop
below the 45 level (support area). If the price of Crude Oil rises above 50 then this
would likely lead to a rally back to the highs made in late October of 2004 in
the mid 50's which would cause some selling pressure to redevelop in the
major averages. On the flip side if the price of Crude Oil drops below 45
then this would lead to a drop back into the lower 40's which may help the major
averages sustain their rally off the late January lows. 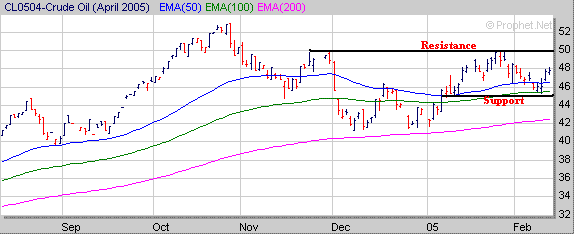
Finally its important to keep an eye
on those stocks which have developed a favorable chart that are in a strong
sector. The Oil stocks have been strong lately and one we featured last
November was ATPG as it was developing a Flat Base. ATPG then broke out of
its Flat Base in early December accompanied by strong volume and has been
trending higher in tandem with the Oil sector. 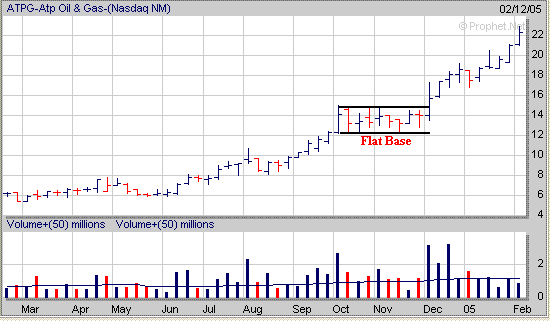
Signup today for a 2
Week Trial Membership and have access to our Stocks
to Watch List which provides a list of Stocks that are exhibiting a
favorable Chart Pattern such as the "Cup and Handle", "Double
Bottom" and "Flat Base". Also you
will receive our Daily Breakout Report
by email which Alerts you to Stocks that
are breaking out of a favorable Chart Pattern from our Stocks
to Watch List.
Click
Here to signup for a "Free" 2 Week Trial Membership
Amateur-Investor.net
|


