|
Signup
today for a "Free" 2 Week Trial Membership
which includes our Stocks to Watch List and Daily Breakout Reports
Weekend Stock Market Analysis
(2/14/04)
In the near term it looks like the Dow and S&P 500 may have
formed small Double Top patterns. If the Dow remains under some selling
pressure the first important support area to watch is around 10400. The
10400 coincides with the Dow's 50 Day EMA (blue line) and was also near the lows
made in January (points A and B). 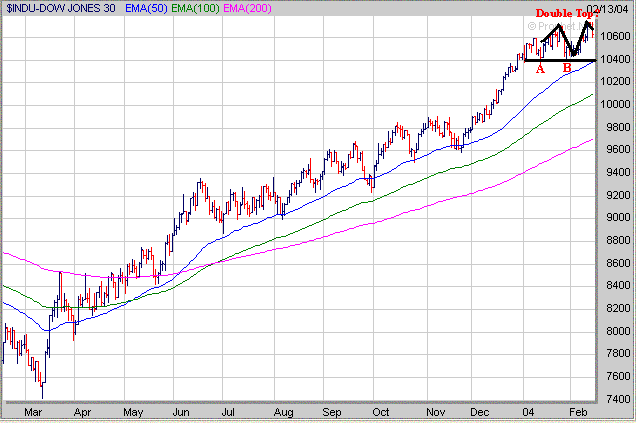
As for the S&P
500 if it comes under more selling pressure the key support area to watch is
around 1120. The 1120 is near the lows made in January (points C and D)
and February (point E) and is also where the 50 Day EMA is
approaching. 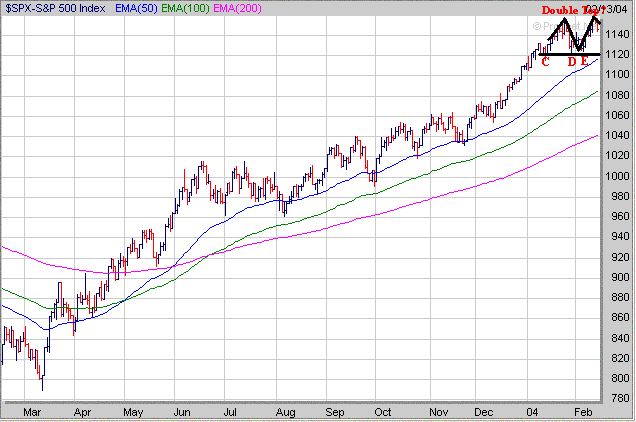
The Nasdaq which
peaked in mid to late Jaunary has stalled out after finding support last Friday
just below its 50 Day EMA (point F) near 2010. If the Nasdaq fails to hold
support at its 50 Day EMA near 2040 then it will likely retest last Friday's
low. 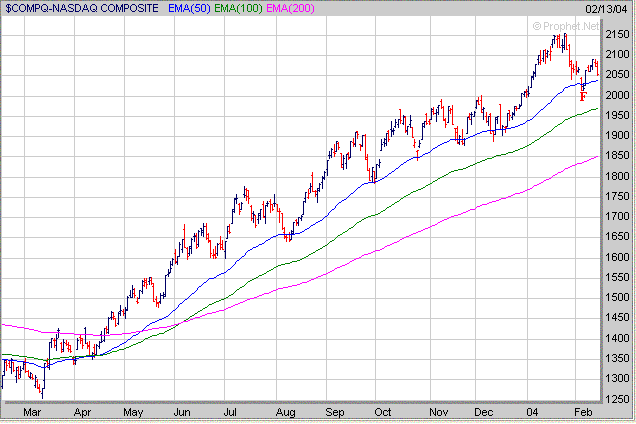
Although it looks
like the Dow and S&P 500 may have made a top in the near term if we look at
the charts from a longer term perspective a few things stand out. First
the Dow has encountered some longer term resistance around the 10700 area
which was near the high made in 2002 (point G) and corresponded to the 76.4%
Retracement Level calculated from the early 2000 high to the October 2002
low. However it also appears the Dow has now traced out the right side of
a 21 month Cup. What we would like to see now is for the Dow to work on
developing a constructive Handle over the next several weeks. 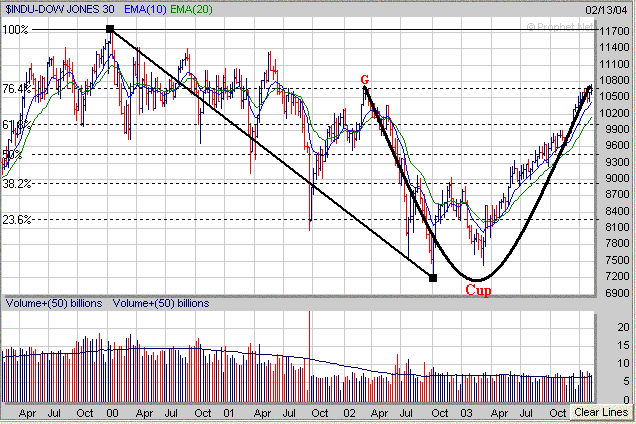
Meanwhile the
S&P 500 has encountered some resistance at its 50% Retracement Level
calculated from the early 200 high to the October 2002 low in the 1155-1160
area. However just like the Dow it appears the S&P 500 has also formed
the right side of a 21 month Cup and now needs to work on developing a
constructive Handle in the weeks ahead. 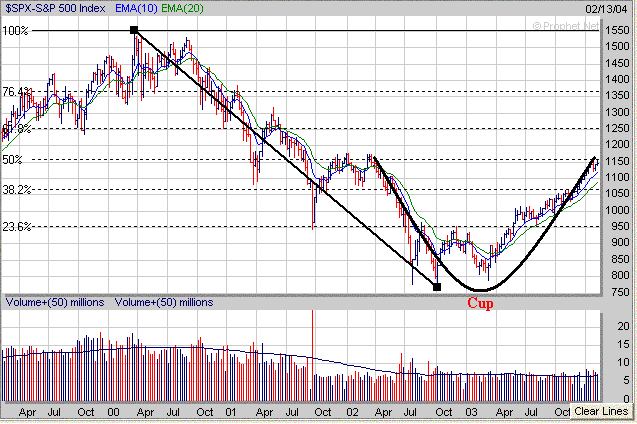
As for the Nasdaq
it also appears to have formed the right side of a 2 year Cup and has been
working on a small Handle (H) over the past 4 weeks. The key thing to
watch in the Nasdaq over the next few weeks is to see if it can hold support at
the bottom of its Handle near 2000. If the Nasdaq doesn't then this would
negate the Handle and could lead to a larger correction. 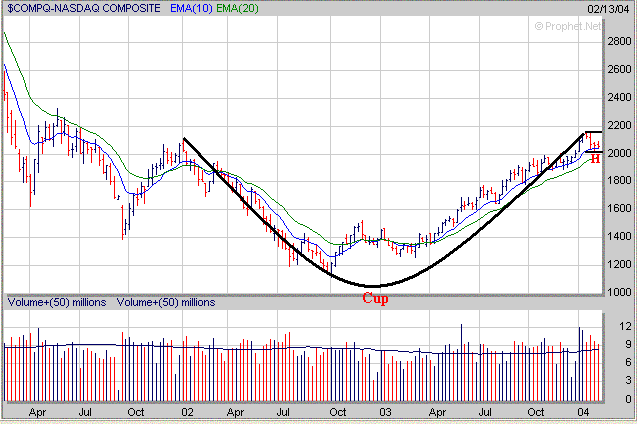
Meanwhile continue
to watch the Semiconductor sector closely as well. If the SMH's fail to
hold support at their 100 Day EMA (green line) near 40.50 then they could drop
back to their 200 Day EMA (purple line) which is currently near 37.50. 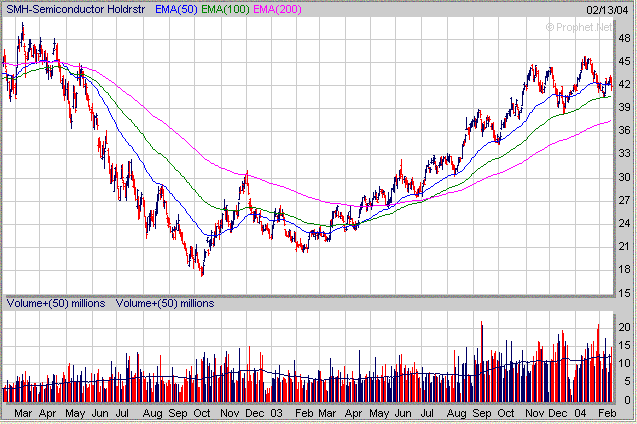
For
those of you that follow the Gold and Silver sector the XAU has found support near
its 10 Monthly EMA which is close to its 200 Day EMA on a daily basis. It
still appears to me that the XAU has formed a 6 year Cup and is beginning to
develop a small Handle (H). For the Handle to remain constructive the XAU
needs to hold support around the 93 level. If the XAU breaks below this
level then the Handle would be negated. 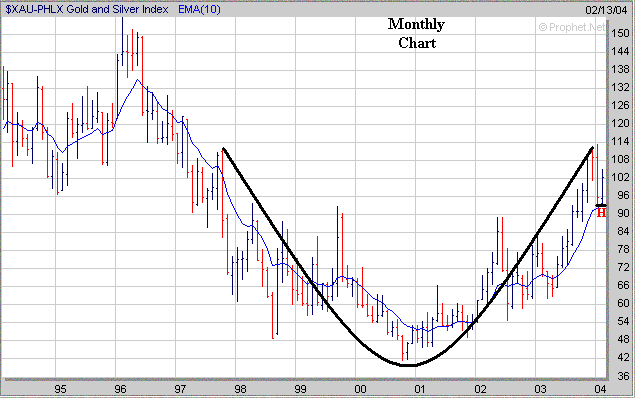
When the market goes
through a consolidation/correction period its very important to notice which
stocks are holding up well versus those that aren't. Those stocks which
break out first as the market begins to rally will usually end up being the
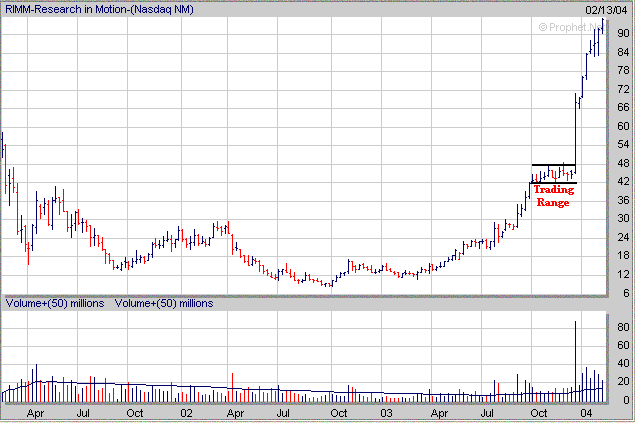
leaders. Notice below how the Nasdaq developed a trading range from last
October through December between 1890 and 2000. Meanwhile notice how
RIMM also developed a trading range between $42 and $48 as well during the same
time period. When the Nasdaq broke out of its trading range in late
December so did RIMM which then doubled in price over the next 8 weeks.
Although this was an extreme case it does show the importance of noticing which
stocks are holding up well during a consolidation/correction period. 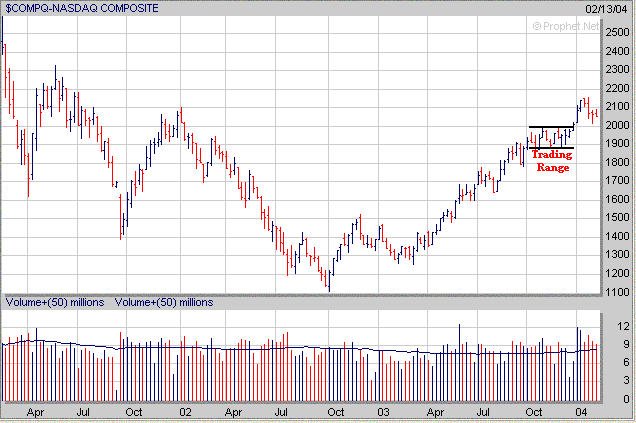
How can a Premium Membership to amateur-investor.net
benefit you as an investor? We focus on stocks which are exhibiting
favorable Sales and Earnings Growth that have developed a favorable chart pattern such as a "Cup and Handle",
"Double Bottom" or "Flat Base". These stocks are then
included in our "Stocks to Watch List" which gives investors a
quick reference to those stocks which may provide the best buying opportunities in the weeks ahead. Each stock in
our "Stocks to Watch List"
includes specific Buy Prices, Stop Loss Prices (very important) and projected
Target Prices.
Signup
Today for a "Free" Trial Membership and see our complete list of
Stocks
which are currently developing a favorable Chart Pattern such as the
"Cup and Handle" or "Double Bottom"
Amateur-Investor.net
|


