|
Click
Here to Signup for a Free Trial Membership and have access to
our Stocks to Watch List and Daily Breakout Reports
Weekend Stock Market Analysis
(2/19/05)
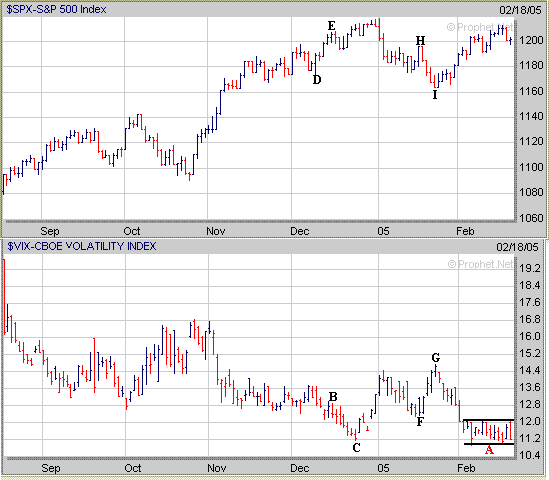
I believe the major averages are getting ready to make a
substantial move in one direction or the other before much longer. This is
based on the fact that the Volatility Index (VIX) has been trading nearly
sideways for three weeks (point A) as the volatility has contracted. Thus
one of two things are likely to happen. Either the VIX will make another
significant move downward like occurred last December (points B to C) which lead
to a sharp upward move in the S&P 500 (points D to E) or the VIX is going to
make a significant move upward (points F to G) leading to a sharp downward move
in the S&P 500 (points H to I) like occurred in mid January.
 At this time it's not clear which
direction the VIX may move but I don't think it's going to move sideways much
longer. As far as the major averages the S&P 500 has stalled
out just below its early January high which was around 1218. If the
S&P 500 is unable to rally above its early January high and comes under
selling pressure look for initial support at its 50 Day EMA (blue line) near
1190. If the S&P 500 drops below 1190 then its next support area would
be in the 1163 to 1172 range which corresponds to its 100 Day EMA (green line)
and late January low (point J). 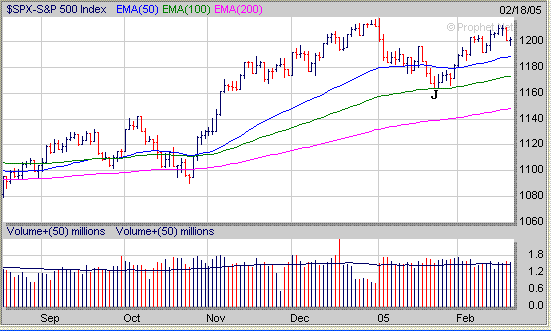
Meanwhile if the S&P 500 is able
to rally above its early January high near 1218 then its next major upside
resistance area would be around 1255 (point K) which corresponds to its longer
term 61.8% Extension Level (calculated from the 2000 high to the 2002 low). 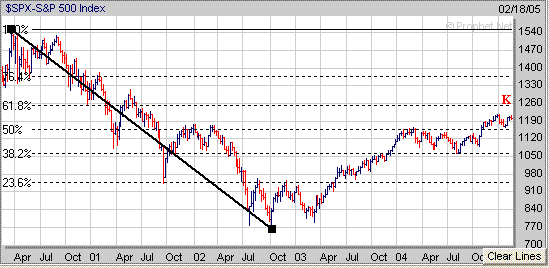
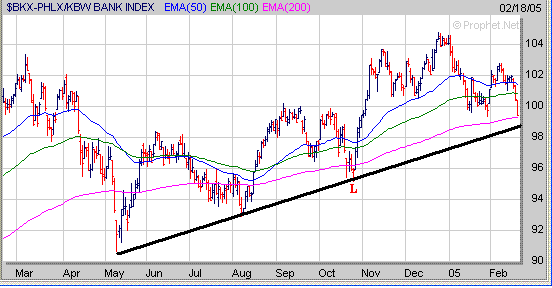
Furthermore keep an eye on Banking
Index (BKX) next week as its approaching a key support area near its 200 Day EMA
(purple line) and upward sloping trend line (black line) originating from the
May 2004 low. What transpires near the 99 level in the BKX is going to
have a significant impact on the S&P 500 as the Banks are heavily weighted
in the index. If the BKX can hold support at its upward sloping trend line
and bounce strongly like occurred in late October (point L) then this would have
a positive affect on the S&P 500. However if the BKX breaks strongly
below its upward sloping trend line this would spell trouble for the S&P
500. 
The Nasdaq has been encountering
resistance near the 2100 level since mid January. Once again it
wasn't able to break above this level this past week and then came under some
selling pressure. A key short term support level to watch in the Nasdaq is
around 2040. If the Nasdaq drops below 2040 this will likely lead to a
retest of its late January low near 2010 (point M) which also corresponds to its
200 Day EMA (purple line). Meanwhile if the Nasdaq holds support near 2040
and attempts to rally once again look for resistance near the 2100
area. 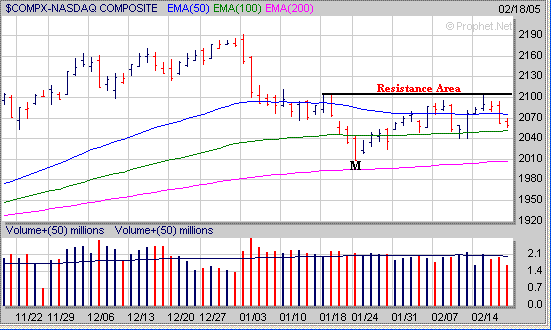
As for the Dow it has stalled out
near its early January high which was around 10870. If the Dow is unable
to break above its early January high and comes under more selling pressure look
for initial support at its 50 Day EMA (blue line) near 10600. If the Dow
drops below 10600 then its next support area would be at its 100 Day EMA near
10500. 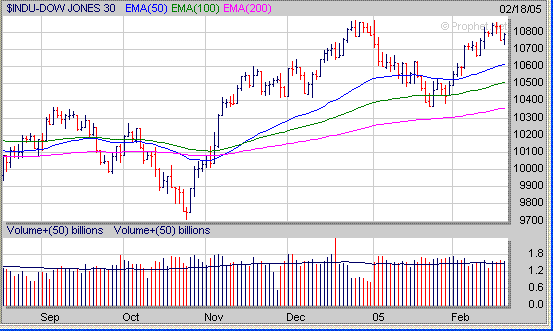
Meanwhile
if the Dow can break strongly above its early January high near 10870 then its
next major upside resistance area would be in the 11200 to 11300 range which
corresponds to its highs made in 2001 (point N). 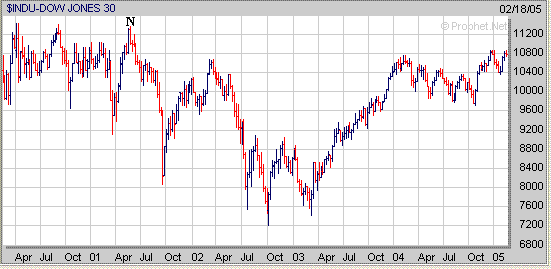
Each week its important to notice
which stocks are developing a constructive chart pattern as they will be the
ones to focus on in the weeks ahead. TIWI is a stock in our Top 100
List which has just completed the right side of a 1 year Cup and now will
need to work on developing a Handle over the next few weeks. 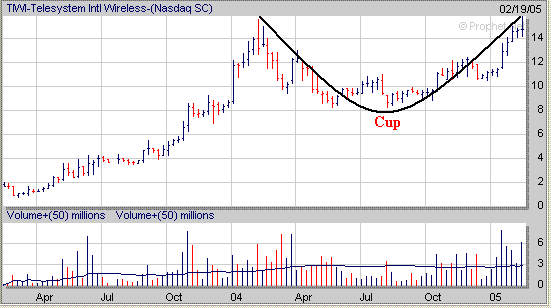
Signup today for a 2
Week Trial Membership and have access to our Stocks
to Watch List which provides a list of Stocks that are exhibiting a
favorable Chart Pattern such as the "Cup and Handle", "Double
Bottom" and "Flat Base". Also you
will receive our Daily Breakout Report
by email which Alerts you to Stocks that
are breaking out of a favorable Chart Pattern from our Stocks
to Watch List.
Click
Here to signup for a "Free" 2 Week Trial Membership
Amateur-Investor.net
|


