|
Weekend Stock Market Analysis
(2/25/06)
Since the late Summer of 2004 both the Nasdaq and S&P 500
have been in steady uptrend although it has been rather choppy. Meanwhile
during the past six weeks the Nasdaq has been basically stuck in a trading range
(TR). The Nasdaq has been encountering resistance just above the 2300
level while finding support just below the 2240 area. At some point the
Nasdaq will break out of its trading range and make a decent move in one
direction or the other. If the Nasdaq was able to break out of its trading
range to the upside it could potentially rise up to around the 2400 area.
Meanwhile if the Nasdaq were to break below the 2240 area then it would probably
drop back to its 40 Weekly EMA (blue line) near 2190. 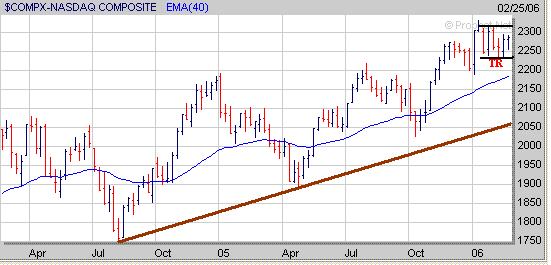
As for the S&P 500 it has also
been in a trading range (TR) as well over the past several weeks with resistance
at the 1295 level while finding support near the 1255 area. If the S&P
500 can break out of its trading range to the upside then look for a move up to
the 1315 level. Meanwhile if the S&P 500 eventually breaks to the
downside instead then look for support at its rising 40 Weekly EMA (blue line)
near 1240. 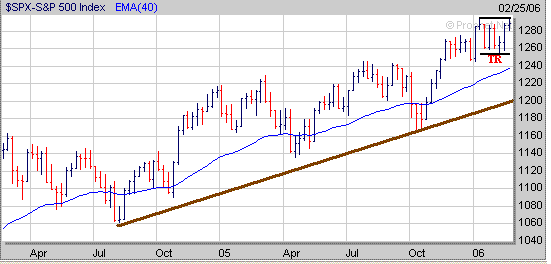
At this point there are a couple of
things to watch which may have an affect on the major averages. The first
thing is the price of Crude Oil. As mentioned last weekend the price of
Crude Oil could be developing a Double Top pattern with a key support area
around 58. If the price of Crude Oil were to eventually drop below the 58
level then this would likely lead to a much larger drop back to its low made
last Spring near 51 (point A) and would likely have a positive affect on the
major averages. On the other hand if the price of Crude Oil were to
maintain support above the 58 level and then break above its 10 Weekly EMA (blue
line) near 64 then this could lead to an eventual rally back to its previous
high just above 70. Of course if this were to happen then this would
likely have a negative affect on the major averages. 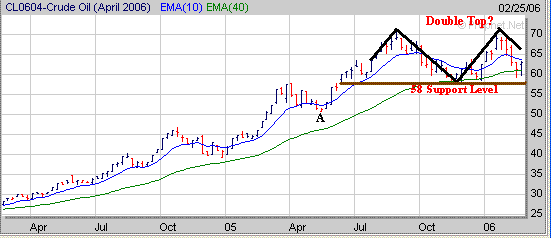
Meanwhile the second thing to watch
is the Semiconductor sector as the Semiconductor Index (SOX) is attempting to
develop a longer term Cup and Handle pattern. The SOX has completed a 4
week Handle (H) but is at a key support level near its 10 Weekly EMA around the
520 area. It appears next week is going to be an important week for the
SOX as it really needs to hold support around the 520 level to maintain its
developing Handle. If the SOX were to drop solidly below the 520 area then
this would invalidate its Handle and likely lead to a drop back to its 40 Weekly
EMA (green line) near 480 which would have a negative affect especially on the
Nasdaq. Meanwhile if the SOX is able to hold support near the 520 level
and then eventually breaks out of its Handle to the upside then this could lead
to a rally back to around the 640 level which would have a positive affect on
the Nasdaq. 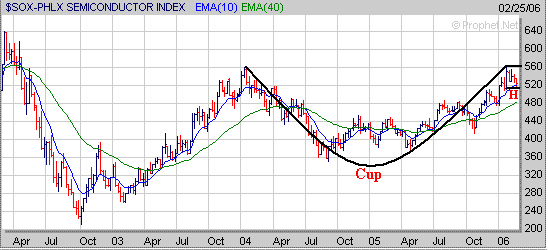
Finally when
searching for stocks to invest in make sure to focus on those that are
exhibiting good Sales and Earnings growth which are breaking out of a proper
chart pattern. In addition to the Cup and Handle pattern also look for
stocks which have developed a Double Bottom pattern or Flat Base pattern as
well. ZUMZ is a stock we focused on early November as it had
developed a Double Bottom pattern and eventually broke out of its 4 week Handle
in late November and then rose around $14. 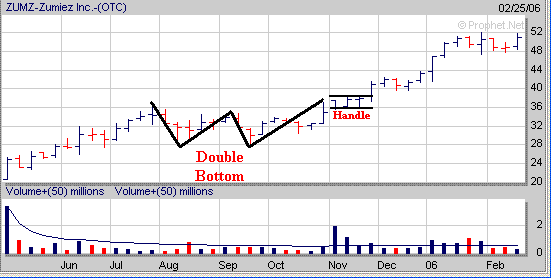
Meanwhile stocks
which are breaking out of a Flat Base pattern also can provide some good
opportunities as well. RAIL broke out of a 7 week Flat Base (FB) in early
January and has risen nearly $18 since then. 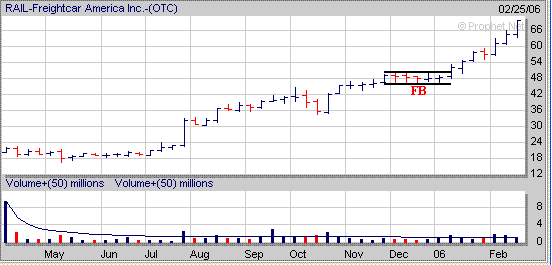
In
2005 our Long Term Investing Strategy finished up 31% while
our Short Term Investing Strategy ended up 64%.
Signup today for a "Free"
2 Week Trial Membership to Amateur Investors and have access to
our current Stocks to Watch Buy List which contains stocks that are currently developing a favorable chart
pattern such as the Cup and Handle, Double Bottom and Flat Base which can be used with either our Long Term
Investing Strategy or Short Term Investing
Strategy.
Also you will have access to these other investment products.
Daily Breakout Reports
Market Timing Indicator
Weekly ETF Buy and Short Signals
Click
Here to Signup for a "Free" 2 Week Trial Membership
Send this Free Newsletter to a Friend or Relative
Amateur-Investors.Com
|

