|
Click
Here to Signup for a Free Trial Membership and have access to
our Stocks to Watch List and Daily Breakout Reports
Weekend Stock Market Analysis
(2/26/05)
The major averages avoided potential trouble last week as they
were able to rally after the big down day last Tuesday. The Dow held
support at its 50 Day EMA (blue line) last week and is now approaching previous
upside resistance just below the 10900 level. The question is will the Dow
stall out for a third time near the 10900 area or will it be able to break
through this time? 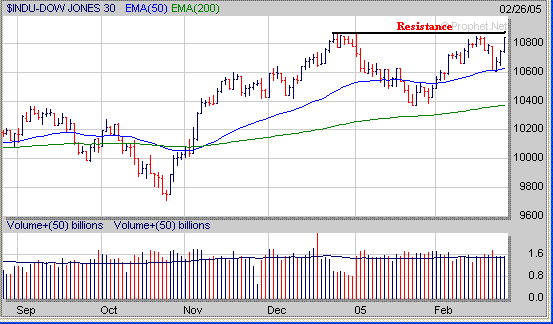
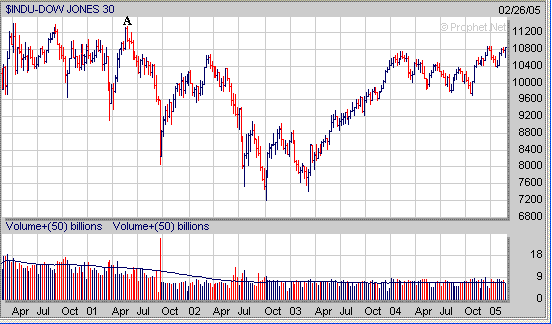
If the Dow is able to break solidly
above the 10900 level then its next major upside resistance area would be in the
11200 to 11300 range which is where it peaked in 2001 (point A).
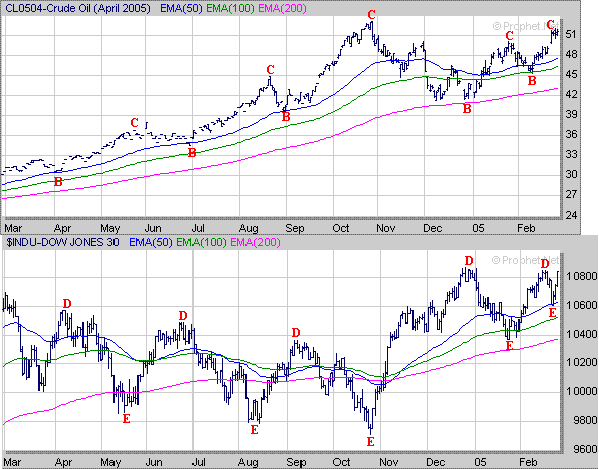
Further upside action in the Dow will likely depend on what the price of Crude
Oil does in the days ahead. Remember the price of Crude Oil and the
Dow have been generally going in opposite directions during the past year or
so. When the price of Crude Oil has risen (points B to C) the Dow has come
under selling pressure (points D to E) and when the price of Crude Oil has
dropped (points C to B) the Dow has rallied (points E to D).
If the price of Crude Oil stalls out in the lower to mid 50's and then begins to
sell off this will likely have a positive affect on the Dow. However if
the price of Crude Oil surges past the mid 50's and heads toward the 60 level this
would likely have a negative affect on the Dow.
 The Nasdaq held support above its
200 Day EMA (green line) this past week and is now approaching its 50 Day EMA
(blue line) near 2070. If the Nasdaq can break above its 50 Day EMA then I
would look for upside resistance in the 2100 to 2110 area which is where it has
stalled out twice before. 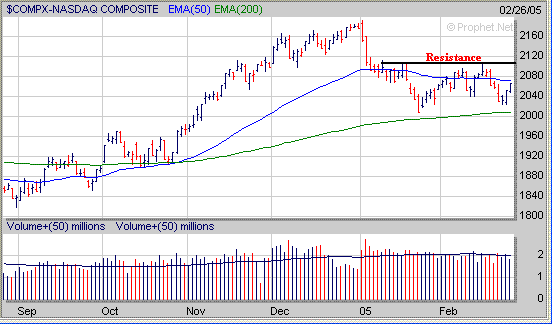
A key sector to watch that will have
an impact on the Nasdaq is the Semiconductors. The Semiconductor Holders (SMH)
so far have been encountering resistance near their 38.2% Extension Level
(calculated from their January 2004 high to their September 2004 low). If
the SMH's can break above the 34.75 level then look for a rally up to either
their 50% Extension Level near 36.50 or their 61.8% Extension Level near 38.50
which would have a positive impact on the Nasdaq. Meanwhile if the SMH's
stall out again near their 38.2% Extension Level and come under selling pressure
then this would have a negative impact on the Nasdaq. 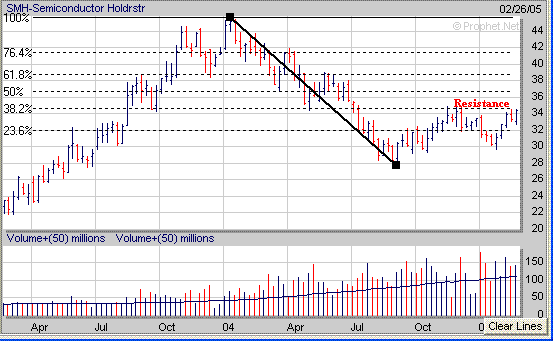
The S&P 500 held support last
week just below its 50 Day EMA (blue line) and is now trying to rally back to
where it peaked in early January near 1218 (point F). It will be
interesting to see if the S&P 500 will be able to rally above its early
January high or whether it will stall out near the 1218 level. 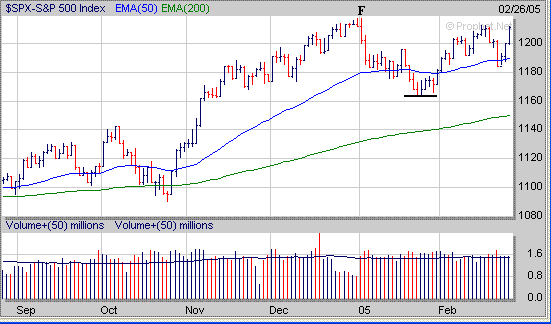
If the S&P 500 is able to take
out its early January high then its next significant upside resistance area would be
around 1255 (point G) which is at its longer term 61.8% Extension Level
(calculated from the 2000 high to the 2002 low). 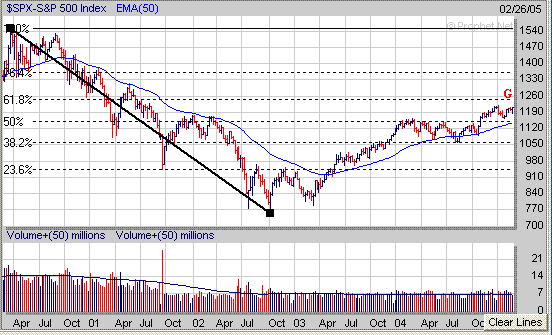
As mentioned in the
past the Banks will
likely determine what transpires in the S&P 500 in the days ahead as they
are heavily weighted in the index. The Banking Index (BKX) held support
last week at its upward sloping trend line originating from the May low near 98
(point H). The key level to watch in the BKX next week is around 101 which
corresponds to its 50 Day EMA (blue line). The last time the BKX found
support at its trend line and rallied above its 50 Day EMA was back in late
October (point I) which led to a significant upward move not only in the BKX but
the S&P 500 as well. If the S&P 500 is going to rise up to the
1255 area mentioned above the BKX is going to have to make a strong move upward
above its 50 Day EMA. Meanwhile if the BKX is unable to break above
its 50 Day EMA near 101 and begins to come under renewed selling pressure this
would have a negative affect on the S&P 500. 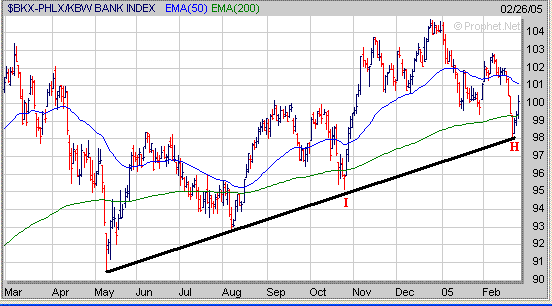
Finally sometimes
you will miss an initial breakout from a favorable chart pattern such as the
"Cup and Handle" pattern, however, the strongest performing stocks will
usually give you a second opportunity to buy them. LYO provides a good
example of a stock which broke out of a small "Cup and Handle" pattern
last August (point J) and continued higher through the end of November (point
K). After making a substantial move upward LYO then began to develop a
trading range between 27 and 30 and over the next few months and formed a "Flat
Base" pattern. LYO then broke out of its "Flat Base"
pattern four weeks ago and gave investors (including us) who missed the initial
breakout last August a second opportunity to buy it in late January. 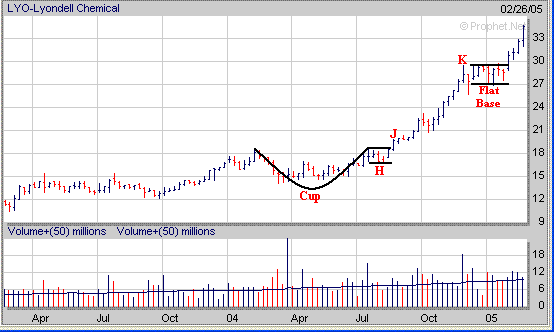
Signup today for a 2
Week Trial Membership and have access to our Stocks
to Watch List which provides a list of Stocks that are exhibiting a
favorable Chart Pattern such as the "Cup and Handle", "Double
Bottom" and "Flat Base". Also you
will receive our Daily Breakout Report
by email which Alerts you to Stocks that
are breaking out of a favorable Chart Pattern from our Stocks
to Watch List.
Click
Here to signup for a "Free" 2 Week Trial Membership
Amateur-Investor.net
|

