|
Signup
today and save 50% on a Premium Membership Plan
which includes our Stocks to Watch List and Daily Breakout Reports
Weekend Stock Market Analysis
(2/28/04)
Although there was some selling pressure this week the major
averages held up pretty well and appear to be in a consolidation mode. One
thing I noticed from the Contrarian Indicators is that the % difference between
the Bearish and Bullish Investment Advisors has begun to rise again. In
fact the % of Bullish Investment Advisors is currently just above 60% (point A)
while the % difference between the Bearish and Bullish Investment Advisors is
now over e 40%. The last time similar readings occurred like this was
back in June of 2003 (point B). 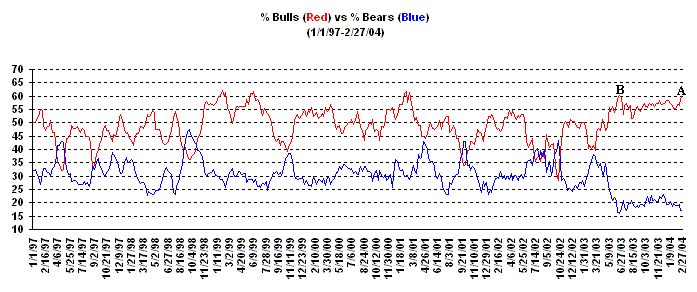 Meanwhile if we
look at a weekly chart of the S&P 500 back in June of 2003 you can see that
it developed a trading range (TR) between 960 and 1020 during the months
of June, July and August before attempting to breakout in September.
Currently the S&P 500 appears to be developing a trading range
(TR) between 1120 and 1160 so it will be interesting to see if the S&P 500
remains locked in a trading range over the next several weeks between 1120 and
1160. 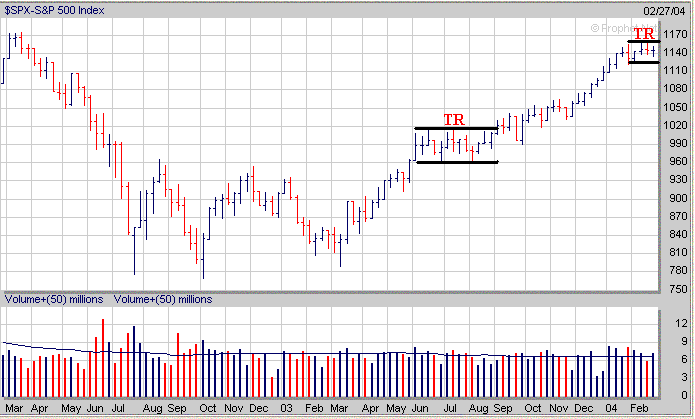
As mentioned in the
beginning so far the major averages appear to be consolidating. Both the
Dow and S&P 500 appear to be developing constructive "Cup
and Handle" patterns in the longer term after breaking out of a
smaller "Cup and Handle" pattern
last Summer. As mentioned before the Dow has stalled out just above
its longer term 76.4% Retracement Level near 10700 (calculated from the early
2000 high to the October 2002 low). As long as the Dow can hold support
around 10400 its developing Handle will remain intact. 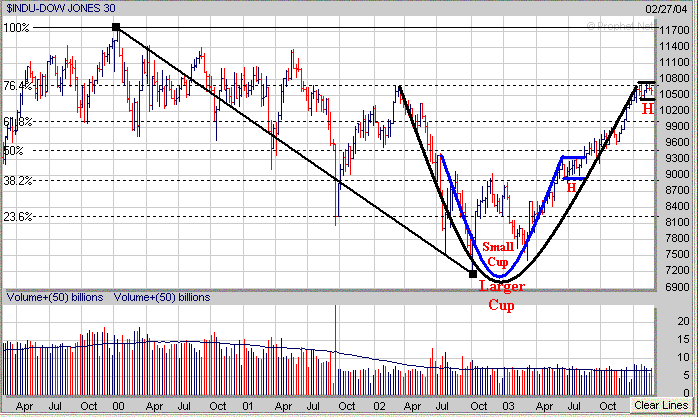
Meanwhile for the
S&P 500 notice how it has stalled out near its longer term 50% Retracement
Level around 1160 (calculated from the early 2000 high to the October 2002
Low). As long as the S&P 500 can hold support near the 1120 area then
its developing Handle will remain intact. 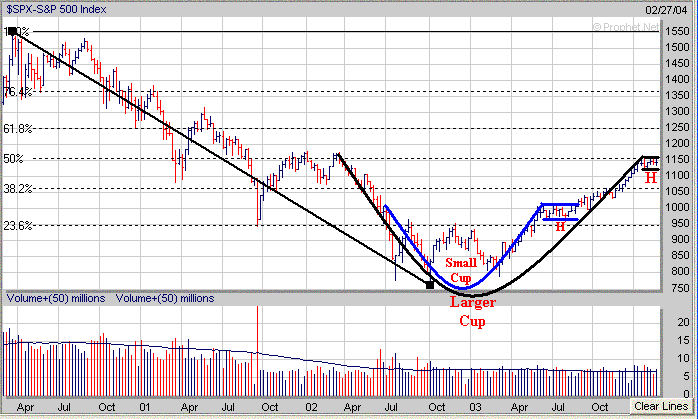
As for the Nasdaq
it also is exhibiting a longer term "Cup and Handle" pattern although
its Handle hasn't been as constructive as the Dow and S&P 500. However
when the Nasdaq developed a 5 week Handle (point C) last Summer it corrected
nearly 7%. Currently the Nasdaq has corrected just above 7% since peaking
in mid January so thus far it hasn't really dropped much more than it did last
Summer (on a percentage basis) while developing a Handle. However over the next few weeks it will
be very important for the Nasdaq to hold support near the 2000 level to keep its
Handle intact. 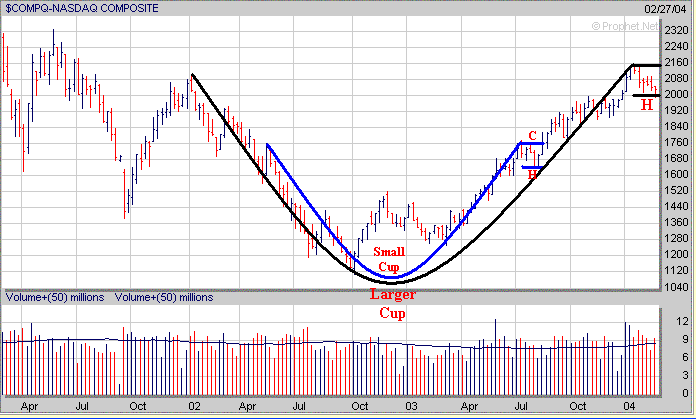
Furthermore as
mentioned in the Mid Week Market Analysis for those of you that follow Elliot
Wave Theory the Nasdaq appears to be undergoing a corrective 4th Wave.
Thus the question remains is this a precursor to the final upward 5th Wave that
will complete the cycle? 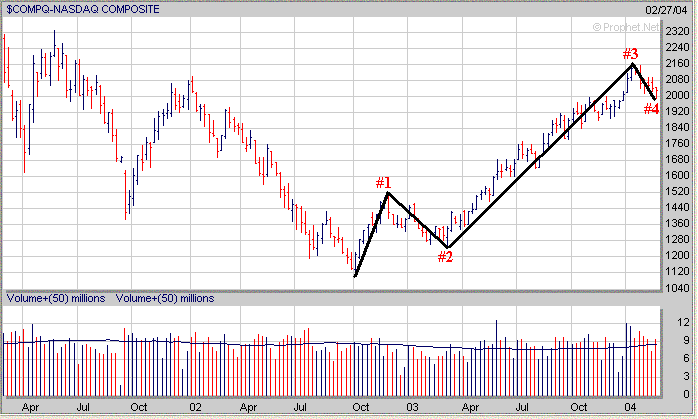
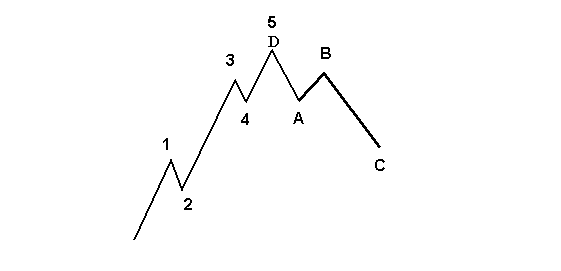
Once again a review of Elliot Wave Theory shows that Waves 1,3
and 5 are upward moves with Wave 3 lasting the longest while Wave 5 is the
shortest. Meanwhile also notice that Waves 2 and 4 are corrective Waves
which only last for a brief period of time before the upward trend continues.
Also note that the final wave (Wave #5) completes the cycle which is then
followed by a longer term correction (points D to C).
Looking at the shorter term as mentioned above the Dow remains
in a trading range (TR) roughly between 10400 and 10750. If the Dow breaks
below 10400 its next support level to the downside would be at its 20 Weekly Day
EMA (green line) near 10200. To the upside once again look for possible
resistance near 10750. 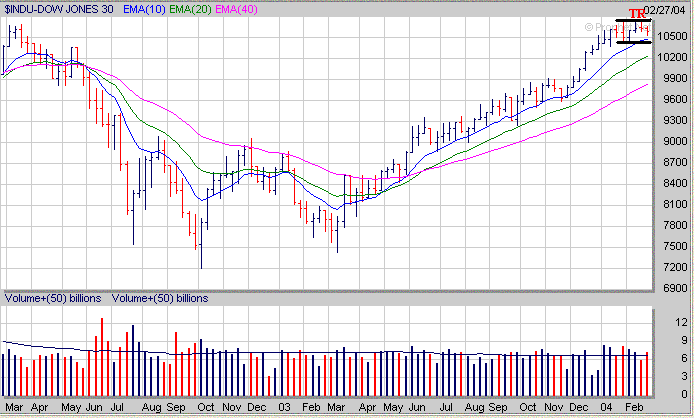
The Nasdaq so far
has held support just above its 20 Weekly EMA near 2000. If the Nasdaq
fails to hold support near 2000 then the next levels of support to the downside
would be in the 1880 (40 Weekly EMA) to 1910 (23.6% Retracement Level calculated
from the October 2002 low to the January high) range. 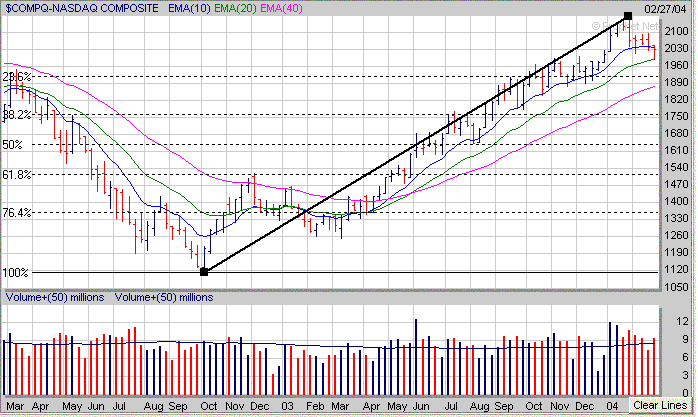
As
for the S&P 500 it remains in a trading range (TR) between 1120 and
1160. If the S&P 500 breaks below the 1120 area which is close to its
10 Weekly EMA (blue line) then the next area of downside support would be at its
20 Weekly EMA (green line) near 1100. To the upside look for resistance in
the 1160 area. 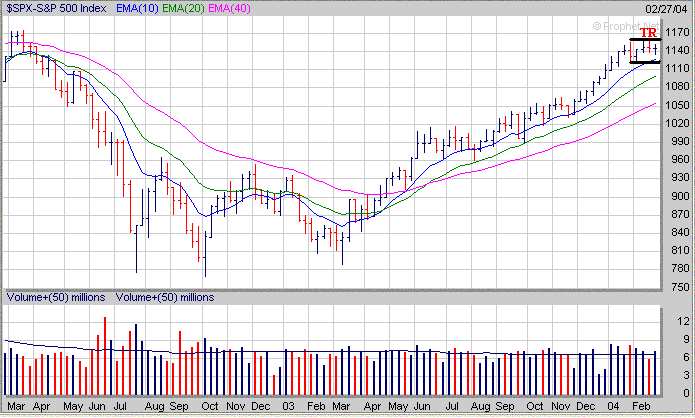
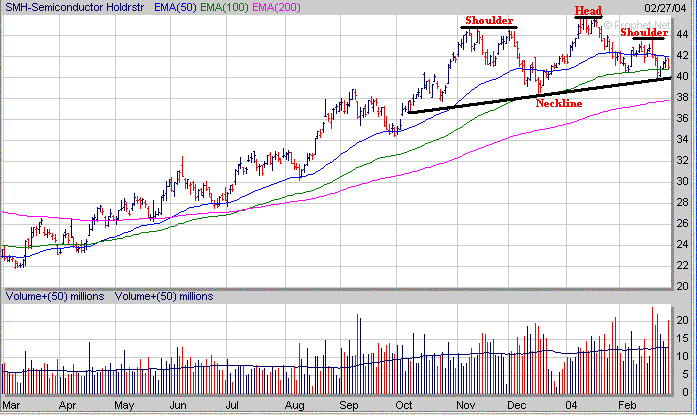
Finally one sector I'm paying close attention to is the
Semiconductors. The Semiconductor Holders (SMH) appear to have developed a
potential Head and Shoulders Top pattern. Thus it will be very important
for the SMH's to hold support near their Neckline which is around 40. If
the SMH's break below 40 then they will likely drop back to their 200 Day EMA
(purple line) near 38 which would likely lead to additional selling pressure
in the Nasdaq.
As you know recognizing chart patterns is very important when
deciding which stocks to invest in. Although I talk about the "Cup
and Handle" pattern quite often another pattern to look for is sometimes
called a "Symmetrical Triangle". An example is shown
below. Notice how TORM gapped up strongly in late February of 2003 (point
E) and then traded nearly sideways over the next 3 months. This allowed
for a "Symmetrical Triangle" pattern to develop as the volatility
lessened from late April through early June and usually is a signal that a
substantial move is nearing. In this case TORM broke out of its
"Symmetrical Triangle" pattern to the upside in mid June on strong
volume (point F). This led to a substantial move from mid June until mid
September in which TORM went from $2.50 to $6.00 for a gain of
140%. Meanwhile those investors which missed
out on TORM's first breakout were recently given a second chance as it broke out
of a "Cup and Handle" pattern during the past two weeks. Notice after TORM made a big move from
mid June to mid September it then sold off some and eventually formed a 3 1/2
month Cup from mid September through December. TORM then developed a 5
week Handle after forming a Cup and then broke out of its Handle two weeks ago
on strong volume (point G). 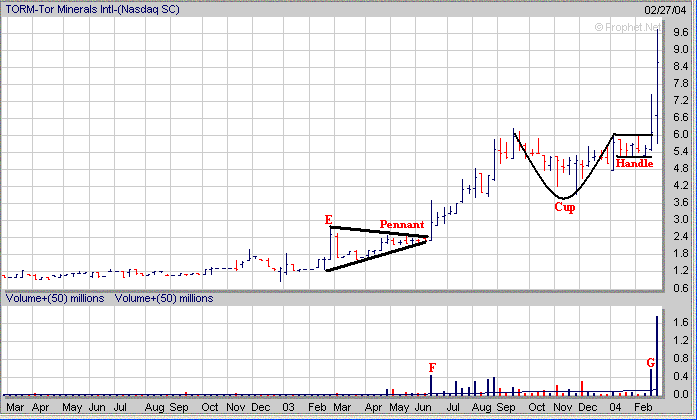
How can a Premium Membership to amateur-investor.net
benefit you as an investor? We focus on stocks which are exhibiting
favorable Sales and Earnings Growth that have developed a favorable chart pattern such as a "Cup and Handle",
"Double Bottom", "Flat Base" or "Symmetrical
Triangle". These stocks are then
included in our "Stocks to Watch List" which gives investors a
quick reference to those stocks which may provide the best buying opportunities in the weeks ahead. Each stock in
our "Stocks to Watch List"
includes specific Buy Prices, Stop Loss Prices (very important) and projected
Target Prices.
Signup
Today for a "Free" Trial Membership and see our complete list of
Stocks
which are currently developing a favorable Chart Pattern such as the
"Cup and Handle" or "Double Bottom"
Amateur-Investor.net
|


