|
Weekend Stock Market Analysis
(2/3/06)
The major averages didn't follow through this week and came
under more selling despite some weakness in the price of Crude Oil. The
current chart of Crude Oil looks similar to what occurred in late 2004 and early
2005 when it developed a Cup and Handle pattern and held support at its 10
Weekly EMA (blue line). Then in mid February the price of Crude Oil broke out
of its 3 week Handle (H) leading to a strong move upward through late March
(points A to B). Thus one thing to watch next week is if the price of
Crude Oil will hold support at its 10 Weekly EMA which is currently just above
the 64 level. If the price of Crude Oil is able to hold support at its 10
Weekly EMA and eventually breaks out of its developing Handle, like occurred last
February, then we could see a significant upward move occur once again which
would likely lead to more selling pressure in the major averages. 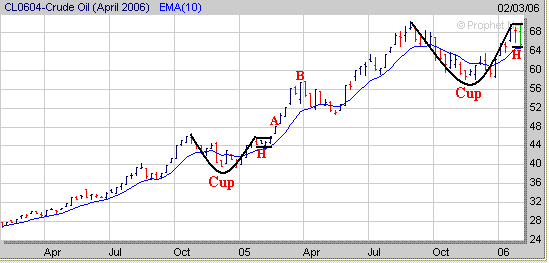
Meanwhile the Volatility Index (VIX)
appears to be developing a potential Double Bottom pattern. If the VIX breaks
above the 15 level then we could see an upward move to the level reached last April in the upper teens (point C). As has
been the case for the past two years when a strong upward move has occurred in the
VIX (points D to E) this has lead to a sharp correction in the S&P 500
(points F to G). 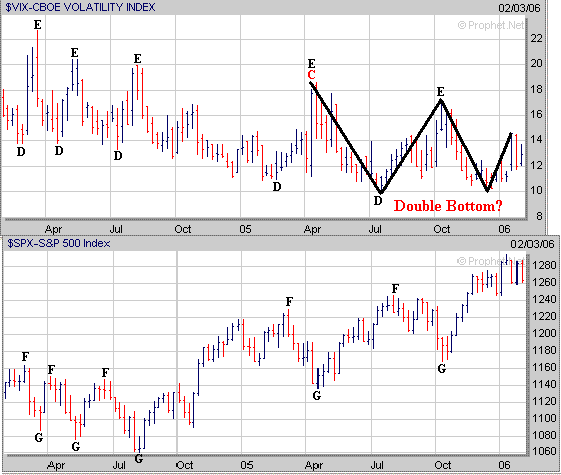
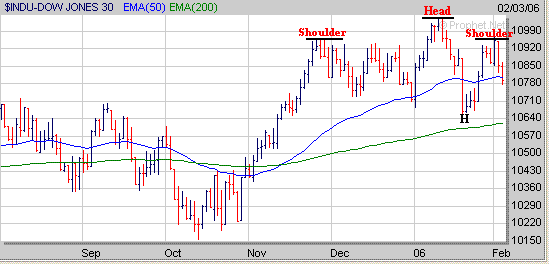
As far as the major averages the Dow closed just below its 50 Day EMA (blue
line) on Friday and it appears it could be developing a Head and Shoulders
Top pattern. If the Dow continues under some selling pressure next week
look for its next support level either at its low made just a few weeks ago near
10650 (point H) or at its 200 Day EMA (green line) near 10630. Meanwhile
if the Dow attempts to reverse to the upside instead look for resistance to
occur at its Shoulder near 10960.
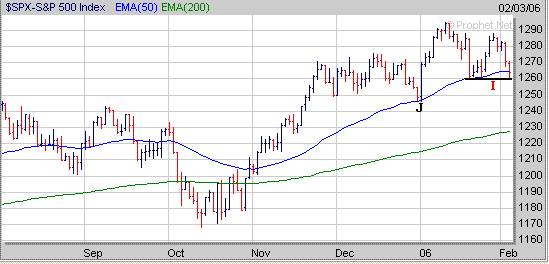
The S&P 500 closed on Friday near its 50 Day EMA (blue line) however the key
support level to watch next week is at 1260 (point I). If the S&P 500
breaks below the 1260 support level then its next area of support would either
be at its low made in early January near 1245 (point J) or at its 200 Day EMA
(green line) near 1228. Meanwhile if the S&P 500 is able to hold
support at the 1260 level and attempts to rally look for resistance to occur in
the 1280 to 1285 range.
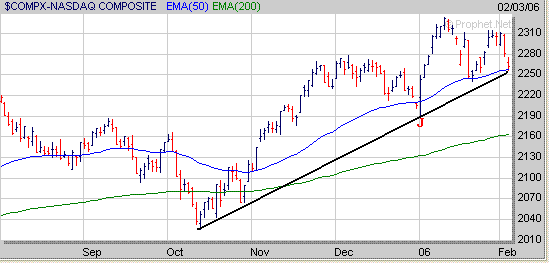
 As for the Nasdaq it has dropped
back to a key support level at its 50 Day EMA (blue line) just above the 2260
level. In addition the Nasdaq's upward sloping trend line (black line)
originating from the low made last October also comes into play near the 2260
area. Thus it will be important for the Nasdaq to hold support near the
2260 level next week. If the Nasdaq is unable to hold support near the
1260 level then its next area of support would either be at the low made in
early January near 2190 (point J) or at its 200 Day EMA (green line) around
2160. Meanwhile if the Nasdaq is able to hold support near 2260 and then
attempts to rally look for upside resistance near the 2310 level.
 Another thing to watch over the next
several weeks is the Semiconductor Sector as the Semiconductor Index (SOX) appears to have formed the
right side of a 2 year Cup. For the SOX to remain constructive it now needs to work on developing a Handle
during the next few weeks while holding
support above the 500 level to complete a Cup and Handle
pattern. 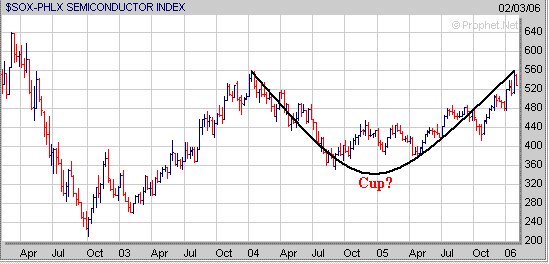
Keep in mind when an Index or a Stock breaks out of a "Cup and Handle"
pattern this can lead to a significant move upward as shown by the chart of HP below.
 If the Semiconductor
Index can form a Cup and Handle pattern and then eventually break out of its
Handle this could lead to a substantial
move upward at some point in the future which would have a positive affect on
the major averages especially the Nasdaq. Meanwhile when the market
is going through a correction start noticing which stocks are holding up the
best and forming a favorable chart pattern as they may become the next market
leaders. For example a stock which is related to the Semiconductor Sector
and has formed a Double Bottom pattern over the past two years is ATHR.
Over the next few weeks I will be watching ATHR closely to see if it can develop
a constructive Handle. 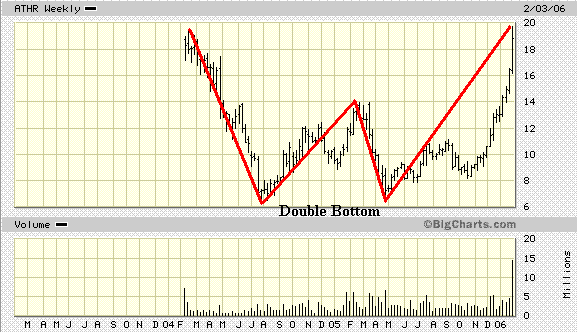
In 2005 our Long Term Investing Strategy finished up 31% while
our Short Term Investing Strategy ended up 64%.
Signup today for a "Free"
2 Week Trial Membership to amateur-investor.net and have access to
our current Stocks to Watch Buy List which contains stocks that are currently developing a favorable chart
pattern such as the Cup and Handle, Double Bottom and Flat Base which can be used with either our Long Term
Investing Strategy or Short Term Investing
Strategy.
Also you will have access to these other investment products.
Daily Breakout Reports
Market Timing Indicator
Weekly ETF Buy and Short Signals
Click
Here to Signup for a "Free" 2 Week Trial Membership
Send this Free Newsletter to a Friend or Relative
Amateur-Investor.net
|


