|
Click
Here to Signup for a Free Trial Membership and have access to
our Stocks to Watch List and Daily Breakout Reports
Weekend Stock Market Analysis
(2/5/05)
The market continues to rally from oversold conditions as the
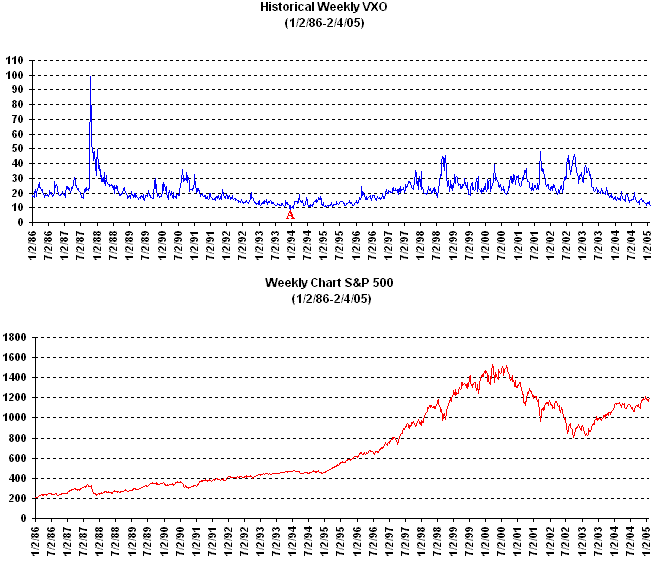
Volatility Index (VXO) is approaching its all time low. The VXO started in
1986 and a longer term weekly chart is shown below. Since its inception in
1986 the lowest reading the VXO has ever dropped too was around 9 in the late
part of 1993 (point A).
For those wondering what happened in late 1993 into the early
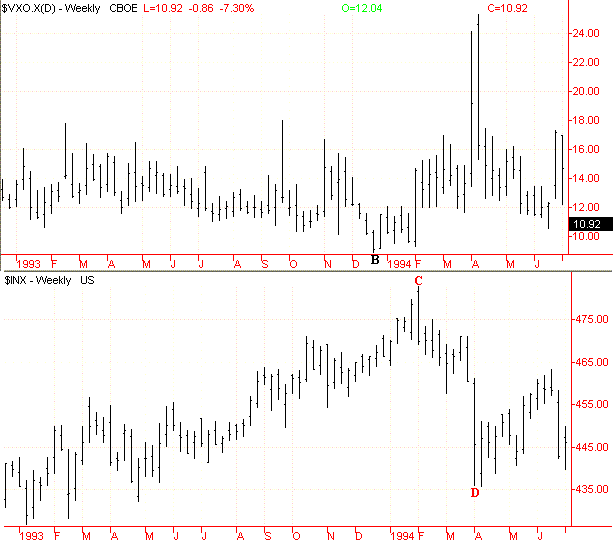
part of 1994 I have plotted a chart comparing the VXO to the S&P 500.
The VXO dropped to around 9 during the last week of 1993 (point B).
Initially the S&P 500 didn't sell off and continued higher for a few weeks
into January of 1994 before topping out just above 480 (point C). However
the very low reading in the VXO was a signal that a substantial correction
wasn't too far away. Eventually the S&P 500 did correct and dropped
around 10% from February through March of 1994 (points C to D).
Although the major averages still could have some more upside in
the near term the very low reading in the VXO is indicating that once this rally
from oversold conditions ends that a substantial correction may follow. As
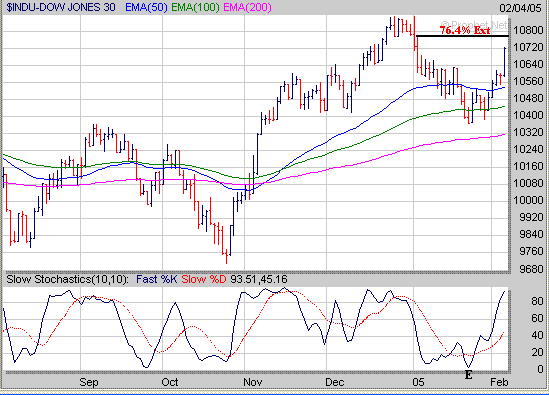
far as the major averages the Dow has now rallied over 300 points since making a
bottom 10 trading days ago as the %K Line in association with the Slow
Stochastics dropped well below 20 (point E) and signaled the Dow had become very
oversold. If the Dow continues to rally its next possible area of
upside resistance would be at its 76.4% Extension Level near 10780 (calculated
from the late December high to the recent low). If the Dow can break above
10780 then it will likely rise up to its late December high near
10900.
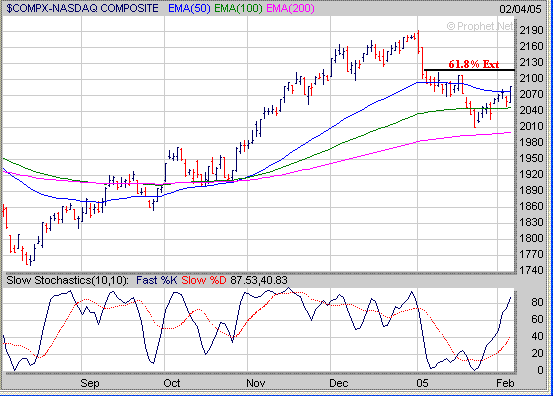
The Nasdaq has risen around 70 points since making a low 10
trading days ago and closed above its 50 Day EMA (blue line) on Friday. If
the Nasdaq continues to rally I would look for upside resistance to occur near
2120 which is at its 61.8% Extension Level (calculated from the early January
high to its recent low).
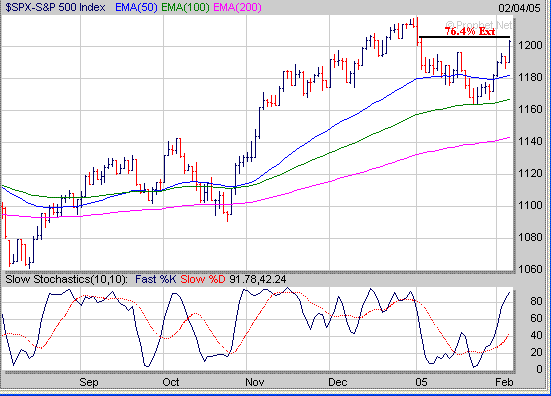
As far as the S&P 500 it has rallied 40 points since making
a bottom 10 trading days ago while finding support at its 100 Day EMA (green
line). The S&P 500 is now approaching its 76.4% Extension Level
(calculated from the early January high to its recent low) near 1206. If
the S&P 500 breaks above 1206 then it will likely rally up to its early
January high near 1220.
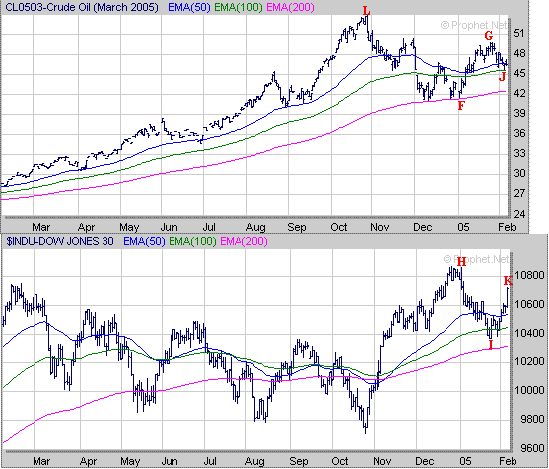
One thing to watch in the days ahead is the price of Crude
Oil. Remember the price of Crude Oil and the Dow have been generally going
in opposite directions during the past year. When the price of Crude Oil
rallied strongly during the first two weeks of January (points F to G) the Dow
sold off (points H to I). Over the past two weeks the price of Crude Oil
has pulled back some (points G to J) as the Dow has rallied from oversold
conditions (points I to K). Currently the price of Crude Oil has
been holding support at its 100 Day EMA (green line) just above 45. and
eventually one of two things may happen. First if the price of Crude Oil
drops below its 100 Day EMA it will likely retest its 200 Day EMA (purple line)
near 42 which may allow the major averages to continue higher.
Meanwhile the second scenario would be for the price of Crude Oil to break above
the 50 level leading to a rise back to its late October high near 55 (point L)
which probably would likely have a negative affect on the major
averages.
 When looking for stocks to purchase
focus on those with decent Sales and Earnings Growth that are beginning to break
out of a favorable chart pattern such as the "Cup and
Handle". Sometimes a "Cup and Handle" pattern can
develop over a shorter period of time and may not be as obvious as one that
forms over a longer period of time. For example HOV formed a small two
month Cup followed by a 3 week Handle (H) before breaking out in early December
accompanied by increasing volume. 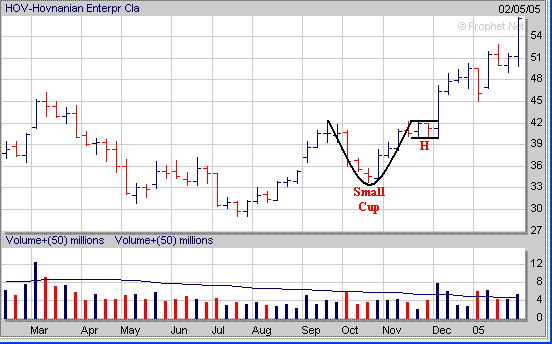
Signup today for a 2
Week Trial Membership and have access to our Stocks
to Watch List which provides a list of Stocks that are exhibiting a
favorable Chart Pattern such as the "Cup and Handle", "Double
Bottom" and "Flat Base". Also you
will receive our Daily Breakout Report
by email which Alerts you to Stocks that
are breaking out of a favorable Chart Pattern from our Stocks
to Watch List.
Click
Here to signup for a "Free" 2 Week Trial Membership
Amateur-Investor.net
|


