|
Signup
today for a "Free" 2 Week Trial Membership
which includes our Stocks to Watch List and Daily Breakout Reports
Weekend Stock Market Analysis
(2/7/04)
The Nasdaq dropped nearly 150 points from its late January high
to the low on Wednesday and once again appears to have found support near its 50
Day EMA (blue line). As mentioned before since last March the Nasdaq has
found support near its 50 Day EMA on several occasions (points A) while
remaining in an up trend. In addition looking at the Slow Stochastics
showed that the Nasdaq had become very oversold as the %K line had dropped below
20 (point B). Over the past year when the %K line has dropped below 20
(points C) the Nasdaq has made a bottom and then rallied. Thus considering
how oversold the Nasdaq had become and that it was approaching its 50 Day EMA
gave us a strong signal that an oversold rally was near. I'm sure many of
you are now wondering will the Nasdaq now rally strongly like occurred the
previous five times it found fund support near its 50 Day EMA (points A) since last
August? 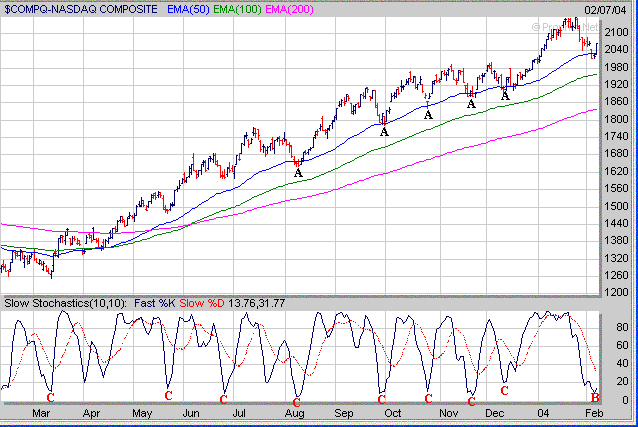
Considering how strongly the Nasdaq
reversed on Friday it may consolidate for a day or two before attempting to
rally further. Looking at a daily 30 minute chart of the Nasdaq over the
past 20 trading days and drawing in Retracement Levels from the high made two
weeks ago to the low made on Thursday shows that the Nasdaq is currently
approaching its 38.2% Retracement Level near 2066. If the Nasdaq can break
above 2066 area there are two short term resistance levels to watch next week
which are at the 50% Retracement Level (near 2084) and 61.8% Retracement Level
(2100). I would imagine the Nasdaq may encounter fairly strong resistance
near its 50% Retracement Level which is also close to where the Nasdaq stalled
out at a week ago near 2086 (point D). 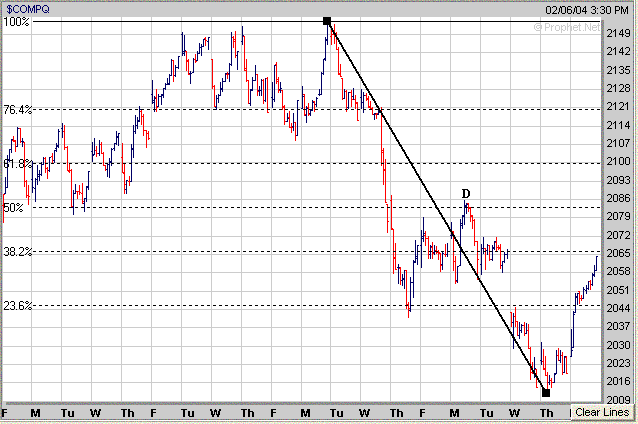
As far as the other major averages
the Dow has held support above its 10 Weekly EMA (blue line) but still has a
significant longer term resistance area around the 10700 level. The 10700
area is the 76.4% Retracement Level from the Dow's early 2000 high to the
October 2002 low. In addition the 10700 level coincides with the Dow's
high made in 2002 (point E). Thus it will be interesting to see if the Dow
will be able to break above the 10700 level next week. 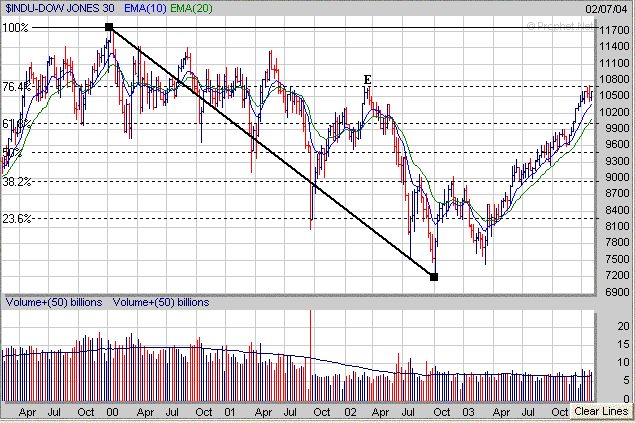
The S&P 500 also has held
support above its 10 Weekly EMA (blue line) and reversed strongly on
Friday. Once again the S&P 500 has a significant resistance zone in
the 1155-1170 range which coincides with its longer term 50% Retracement Level
near 1155 and the high made in 2002 near 1170 (point F). 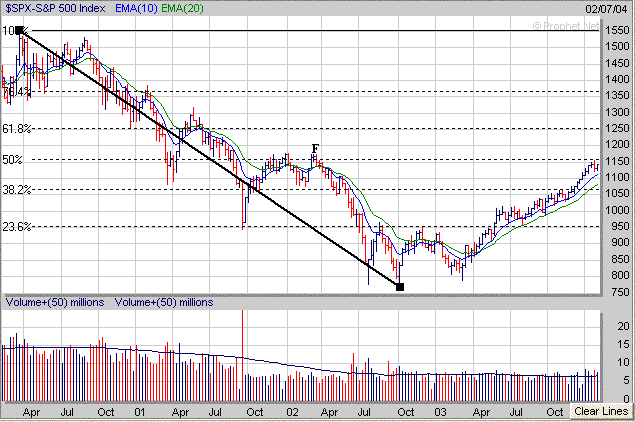
Looking at the Seminconductor sector
the Seminconductor Holders (SMH) were able to hold support at a key level last
week near their 100 Day EMA (green line) and upward sloping trend line (black
line) from last February's low. Just like the Nasdaq the SMH's had become
extremely oversold and were due for an oversold rally based on the Slow
Stochastics as the %K line had dropped below 20 (point G). I'm sure a lot
of investors are hoping the SMH's will rally strongly like occurred last
December when they found support at their 100 Day EMA (point H). 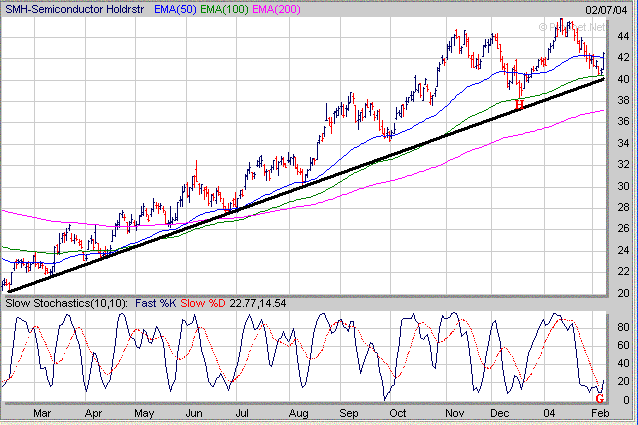
As usual when looking for stocks to
invest in focus on those which are exhibiting a favorable chart pattern.
This is especially important when the market is undergoing a correction as they
will usually be the first ones to break out when the market makes a bottom and
then reverses to the upside. WIRE is a good example of a stock
which was in our Stocks to Watch List in December as it had developed a
"Cup and Handle" pattern before breaking out in early January.
Sometimes a stock will attempt to break out of its Handle but fail a few times
and drop back into its Handle. Notice WIRE attempted to break out of its
Handle on three separate occasions (points I) prior to January but dropped back into its
Handle before finally following through in early January. 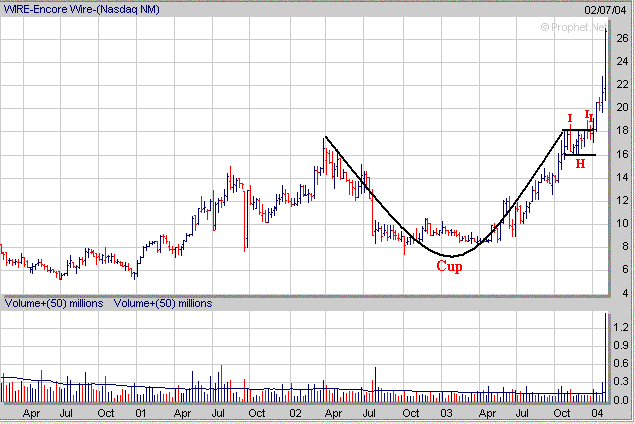
How can a Premium Membership to amateur-investor.net
benefit you as an investor? We focus on stocks which are exhibiting
favorable Sales and Earnings Growth that have developed a favorable chart pattern such as a "Cup and Handle",
"Double Bottom" or "Flat Base". These stocks are then
included in our "Stocks to Watch List" which gives investors a
quick reference to those stocks which may provide the best buying opportunities in the weeks ahead. Each stock in
our "Stocks to Watch List"
includes specific Buy Prices, Stop Loss Prices (very important) and projected
Target Prices.
Signup
Today for a "Free" Trial Membership and see our complete list of
Stocks
which are currently developing a favorable Chart Pattern such as the
"Cup and Handle" or "Double Bottom"
Amateur-Investor.net
|


