|
Weekend Stock Market Analysis
(1/14/06)
The major averages are starting to go through a minor pullback
but as long as they can hold support at or above their 20 Day EMA's in the near
term then the rally that started on January 3rd should remain intact. The
Dow's 20 Day EMA (blue line) is near 10890 and this will be a support area to
watch early next week. If the Dow were unable to find support at its 20
Day EMA then its next area of support would be at its rising 50 Day EMA (green
line) near 10800. 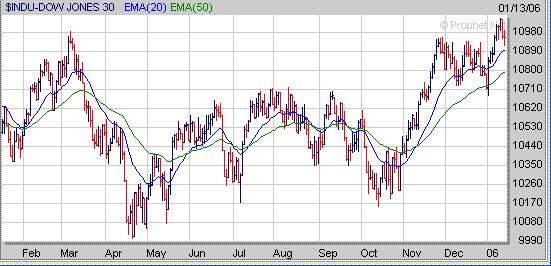
Meanwhile
if the Dow is able to hold support near the 10890 level and then eventually
rises back above the 11000 area then its next area of longer term upside
resistance is in the 11300 to 11350 range which is where it stalled out at in
2001 (point A) after bouncing from oversold conditions. 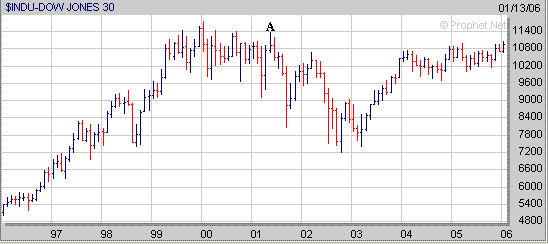
The Nasdaq has pulled back
slightly but still remains well above its rising 20 Day EMA (blue line) near
2280. As long as the Nasdaq can hold support at or above its 20 Day EMA
then the rally that began on January 3rd should continue. As
mentioned before the Nasdaq is acting similar to what occurred last June and
July when it found support near its 50 Day EMA (point B) after rallying strongly
during the month of May (points C to D). This was then followed by
another decent rally in the month of July (points B to E) with the Nasdaq
peaking in early August. From May through early August the Nasdaq gained
just over 17% and if a similar pattern occurs again then a 17% gain from the mid
October bottom would give us a potential rally up to the 2360 to 2370 level.. 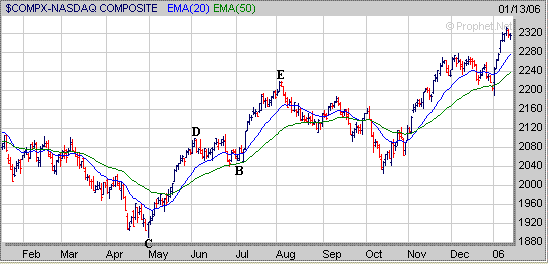
The S&P 500 also has
pulled back a little however it still remains above its rising 20 Day EMA (blue
line) near 1275. As long as the S&P 500 can hold support at or above
its 20 Day EMA then the rally from the January 3rd low should remain intact. 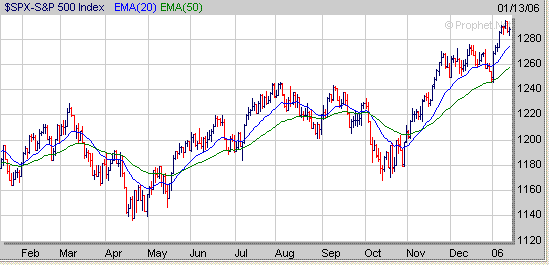
If
the S&P 500 is able to hold support near the 1275 level and eventually moves
higher again it appears that the next area of upside resistance would be
around the 1315 level which is where the S&P 500 stalled out at in 2001
(point F) after bouncing from oversold conditions. 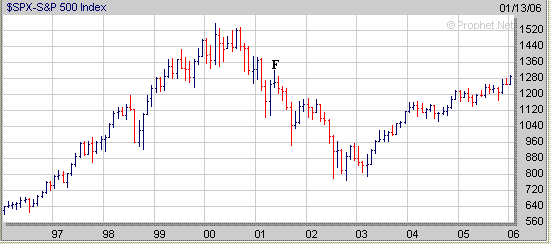
Although the major averages could
continue higher in the near term I'm still paying close attention to the
Put to Call Ratio and the Volatility Index (VXO). The 5 Day
Average of the Put to Call Ratio has been trending downward again and is
currently around 0.7. In the past when the 5 Day Average of the Put to
Call Ratio has dropped to around 0.6 (points G) this has signaled a nearing top
followed by a correction of differing magnitudes (points H to I). Thus any
further drop in the 5 Day Average of the Put to Call Ratio over the next few
weeks could pose problems for the longer term. 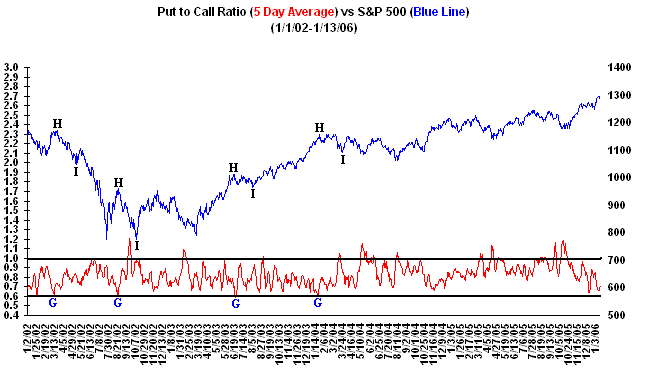
Meanwhile the Volatility Index (VXO)
also remains quite low but still is above the 52 week low made in the latter
half of July (point J) which signaled a nearing top followed by a correction in
the S&P 500 (points K to L). Thus if the VXO were to drop back to its
July low near 9 then that would be a strong signal that the S&P 500 could be
getting close to a top. 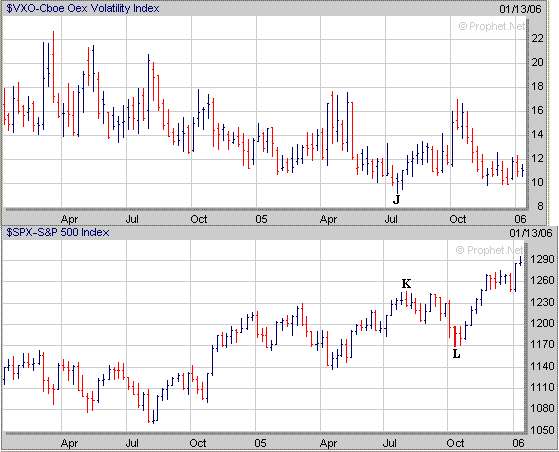
Finally at Amateur Investors we
provide two types of Trading Strategies for investors. Our Long Term
Strategy is for those investors who are seeking a longer term gain that may
occur over a timeframe lasting from several days to several weeks.
Meanwhile our Short Term Strategy is for those investors that are seeking a
short term gain over a much shorter period of time. Let's look at
a recent stock from our Stocks to Watch List and apply both strategies. TRAD developed a Cup and
Handle pattern and broke out just over a week ago from its 4 week Handle.
In our Long Term Strategy the entry price was around $14.20 which was the Pivot
Point and our initial target price for TRAD is at $18. Meanwhile the
initial Stop Loss Order should have been placed at $13 which is roughly 8% below
the entry price of $14.20 in case TRAD fails to follow through to the upside in
the weeks ahead. 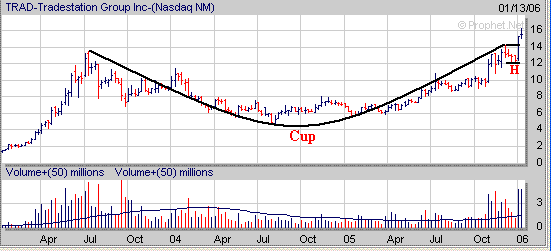
Meanwhile
in our Short Term Strategy the entry price remains the same at $14.20 however
our initial target price is much lower at $15.20 since we are only looking to
hold a stock for a short period of time (3 days or less). In addition the
initial Stop Loss Order is set $1 below the entry price which would
have been $13.20 in case TRAD had failed to follow through on its breakout
attempt. A 30 minute daily chart of TRAD below shows the entry price was
reached on January 5th (point M) as it began to break out of its Handle.
Over the next two trading days TRAD then continued higher and the position was
closed as it exceeded our initial target price of $15.20 and then reached our
2nd target price of $16.20 (point N) on the third day. 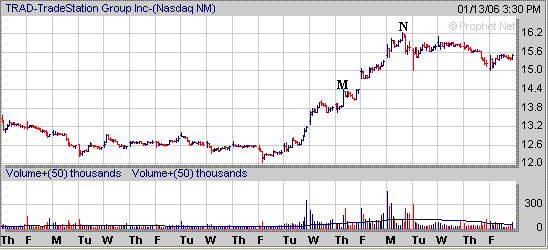
In 2005 our Long Term Investing Strategy finished up 31% while
our Short Term Investing Strategy ended up 64%.
Signup today for a "Free"
2 Week Trial Membership to amateur-investor.net and have access to
our current Stocks to Watch Buy List which contains stocks that are currently developing a favorable chart
pattern such as the Cup and Handle, Double Bottom and Flat Base which can be used with either our Long Term
Investing Strategy or Short Term Investing
Strategy.
Also you will have access to these other investment products.
Daily Breakout Reports
Market Timing Indicator
Weekly ETF Buy and Short Signals
Click
Here to Signup for a "Free" 2 Week Trial Membership
Send this Free Newsletter to a Friend or Relative
Amateur-Investor.net
|


