|
Click
Here to Signup for a Free Trial Membership and have access to
our Stocks to Watch List and Daily Breakout Reports
Weekend Stock Market Analysis
(1/15/05)
A few weeks ago it looked like Crude Oil was potentially
exhibiting a Head and Shoulders Top pattern however this week the price of Crude
Oil broke above its 2nd Shoulder (2S). The question is now will the price
of Crude Oil eventually rise back to the late October high in the mid
50's? 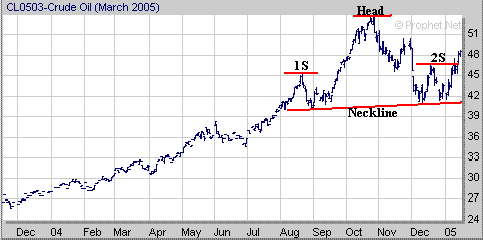
Although most people
attributed the recent sell off in the
market due to profit taking the recent rally in the price of Crude Oil the past
two weeks may have played a bigger role. Remember over the past year the
price of Crude Oil and the Dow have been basically going in opposite
directions. When the price of Crude Oil has rallied (points A to B) the
Dow has sold off (points C to D) and when the price of Crude Oil has sold off
(points B to A) the Dow has rallied (points D to C). 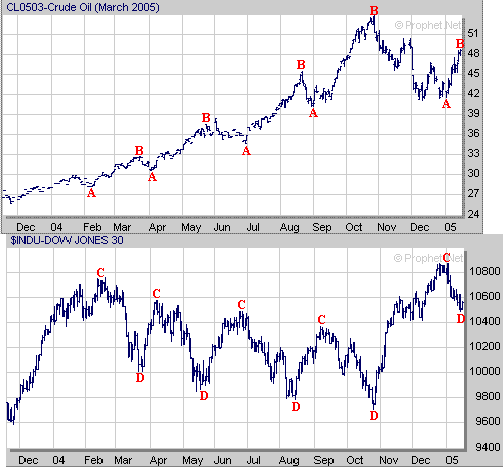 If the price of Crude Oil does
continue to rise and eventually rallies back to its late October high in the mid
50's this could lead to more downside pressure in the major averages. As far as the major averages the Dow broke
below its 50 Day EMA this week and has dropped around 400 points since the
beginning of the year. In the near term if the Dow attempts to bounce from
oversold conditions I would look for upside resistance near 10680 (point
A). Meanwhile if a bounce doesn't occur and the Dow continues lower its
next support area resides near 10440 which is where its 100 Day EMA (green
line) and 38.2% Retracement Level (calculated from the October low to the
December high) reside at. 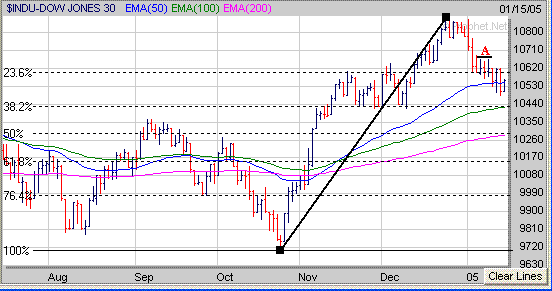
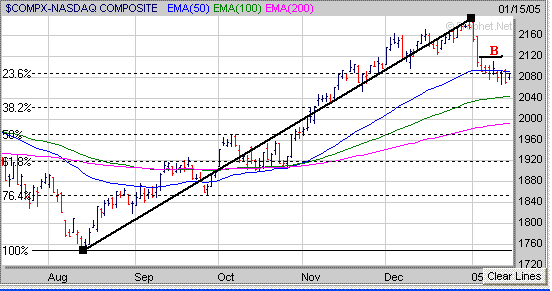
The
Nasdaq remains just below its 50 Day EMA (blue line) and has dropped around 100
points since the first of the year. In the near term if the Nasdaq
attempts to bounce from oversold conditions look for possible resistance near
2120 (point B). Meanwhile if the Nasdaq doesn't bounce and continues lower
its next level of support would be in the 2025 to 2040 range which coincides
with its 100 Day EMA (green line) and 38.2% Retracement Level (calculated from
the August low to the December high).
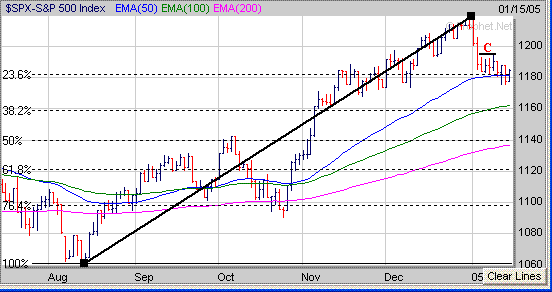
 The S&P 500 also dropped below
its 50 Day EMA (blue line) this week but did manage to close back above it on
Friday. In the near term if the S&P 500 attempts to bounce from
oversold conditions look for initial upside resistance around 1195 (point
C). Meanwhile if the S&P 500 continues lower its next support area
would be around 1160 which is where its 100 Day EMA (green line) and 38.2%
Retracement Level (calculated from the August low to the December high) reside
at.
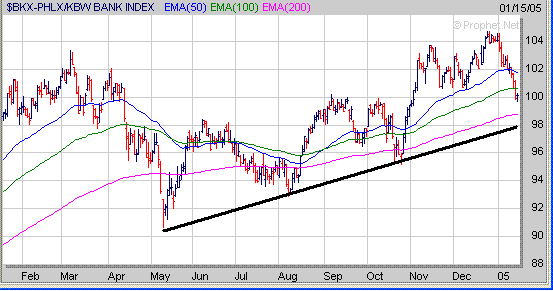
A sector to watch will have an impact on the S&P 500 is the
Banking Index (BKX) as the Banks are heavily weighted in the S&P 500.
Since peaking in late December the BKX has been hit rather hard and has recently
dropped below its 100 Day EMA (green line). A key support area to watch in
the days ahead would be in the 98 to 99 range which coincides with the BKX's 200
Day EMA (purple line) and upward sloping trend line (solid black line) from the
May low. If the BKX breaks below its upward sloping trend line this would
spell trouble not only for the BKX but the S&P 500 as well.
Finally when looking for stocks to invest in focus on those that
are exhibiting decent Sales and Earnings Growth versus those that
aren't. For example let's compare the Sales and Earnings Growth
trends of AEOS versus MSFT over the past two years.
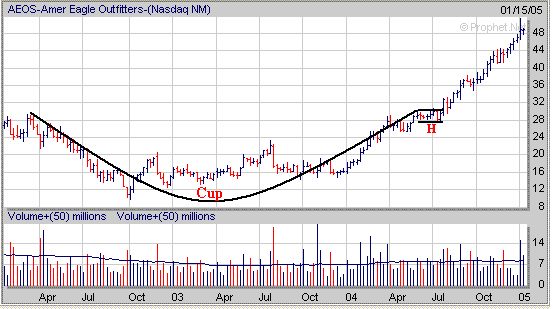
During the past two years AEOS saw an acceleration of Sales and
Earnings Growth from 2003 into 2004 as it developed a longer term Cup and Handle
pattern. AEOS eventually broke out of its Handle (H) last Summer and has
been in a steady up trend since then. In 2004 AEOS gained nearly 200%.

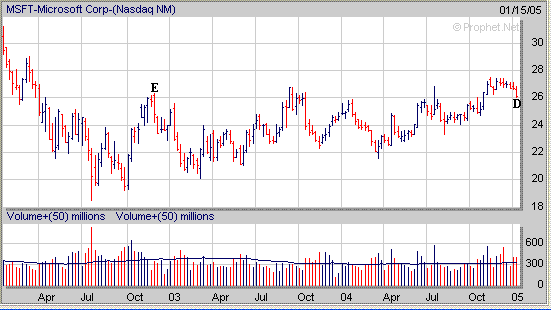
Meanwhile if we compare the Sales and Earnings Growth of MSFT to
AEOS you can see in 2004 MSFT has been experiencing decelerating Sales and
Earnings Growth. In fact outside of a few good quarters in late 2003 and
early 2004 MSFT hasn't seen any decent Sales or Earnings Growth going back
through at least 2002. This has been reflected in MSFT's performance over
the past few years as its current stock price (point D) is basically the same as
it was in late 2002 (point E).

This is why it's important to focus on those companies which are
showing an increase in Sales and Earnings Growth versus those that
aren't.
Signup today for a 2
Week Trial Membership and have access to our Stocks
to Watch List which provides a list of Stocks that are exhibiting a
favorable Chart Pattern such as the "Cup and Handle", "Double
Bottom" and "Flat Base". Also you
will receive our Daily Breakout Report
by email which Alerts you to Stocks that
are breaking out of a favorable Chart Pattern from our Stocks
to Watch List.
Click
Here to signup for a "Free" 2 Week Trial Membership
Amateur-Investor.net
|


