|
Our 50% Off Special has
been extended through January 3rd
Click
Here to Signup for a Premium Membership and save 50%
which includes our Stocks to Watch List and Daily Breakout Reports
Weekend Stock Market Analysis
(1/1/05)
The major averages all ended up in 2004 with the S&P 500
leading the way at +9.0% while the Nasdaq was up +8.6% and the Dow +3.1%.
Meanwhile I'm sure some of you have heard that since 1900 when the year ends in
the number "5" the Dow has always been up significantly. A table
showing the Dow's Yearly Performance since the late 1890's is shown below with
the years ending in the number "5" highlighted.
| Dow Yearly Performance
(1896-2004) |
| Year |
Return |
Year |
Return |
Year |
Return |
Year |
Return |
| 1896 |
NA |
1926 |
0.3% |
1956 |
2.3% |
1986 |
22.6% |
| 1897 |
22.2% |
1927 |
28.8% |
1957 |
-12.8% |
1987 |
2.3% |
| 1898 |
22.5% |
1928 |
48.2% |
1958 |
34.0% |
1988 |
11.8% |
| 1899 |
9.2% |
1929 |
-17.2% |
1959 |
16.4% |
1989 |
27.0% |
| 1900 |
7.0% |
1930 |
-33.8% |
1960 |
-9.3% |
1990 |
-4.3% |
| 1901 |
-8.7% |
1931 |
-52.7% |
1961 |
18.7% |
1991 |
20.3% |
| 1902 |
-0.4% |
1932 |
-23.1% |
1962 |
-10.8% |
1992 |
4.2% |
| 1903 |
-23.6% |
1933 |
66.7% |
1963 |
17.0% |
1993 |
13.7% |
| 1904 |
41.7% |
1934 |
4.1% |
1964 |
14.6% |
1994 |
2.1% |
| 1905 |
38.2% |
1935 |
38.5% |
1965 |
10.9% |
1995 |
33.5% |
| 1906 |
-1.9% |
1936 |
24.8% |
1966 |
-18.9% |
1996 |
26.0% |
| 1907 |
-37.7% |
1937 |
-32.8% |
1967 |
15.2% |
1997 |
22.6% |
| 1908 |
46.6% |
1938 |
28.1% |
1968 |
4.3% |
1998 |
16.1% |
| 1909 |
15.0% |
1939 |
-2.9% |
1969 |
-15.2% |
1999 |
25.2% |
| 1910 |
-17.9% |
1940 |
-12.7% |
1970 |
4.8% |
2000 |
-6.2% |
| 1911 |
0.4% |
1941 |
-15.4% |
1971 |
6.1% |
2001 |
-7.1% |
| 1912 |
7.6% |
1942 |
7.6% |
1972 |
14.6% |
2002 |
-15.8% |
| 1913 |
-10.3% |
1943 |
13.8% |
1973 |
-16.6% |
2003 |
25.3% |
| 1914 |
-30.7% |
1944 |
12.1% |
1974 |
-27.6% |
2004 |
3.1% |
| 1915 |
81.7% |
1945 |
26.6% |
1975 |
38.3% |
|
|
| 1916 |
-4.2% |
1946 |
-8.1% |
1976 |
17.9% |
|
|
| 1917 |
-21.7% |
1947 |
2.2% |
1977 |
-17.3% |
|
|
| 1918 |
10.5% |
1948 |
-2.1% |
1978 |
-3.1% |
|
|
| 1919 |
30.5% |
1949 |
12.9% |
1979 |
4.2% |
|
|
| 1920 |
-32.9% |
1950 |
17.6% |
1980 |
14.9% |
|
|
| 1921 |
12.7% |
1951 |
14.4% |
1981 |
-9.2% |
|
|
| 1922 |
21.7% |
1952 |
8.4% |
1982 |
19.6% |
|
|
| 1923 |
-3.3% |
1953 |
-3.8% |
1983 |
20.3% |
|
|
| 1924 |
26.2% |
1954 |
44.0% |
1984 |
-3.7% |
|
|
| 1925 |
30.0% |
1955 |
20.8% |
1985 |
27.7% |
|
|
Thus I guess if you are a gambler the odds of 2005 being up
significantly are stacked in your favor. However just because this has
worked in the past doesn't mean it will this time so we shall see what happens
in 2005.
As I mentioned in the early part of 2004 the chart of the Nasdaq
from the 1990's through 2003 looked rather similar to the chart of the Dow from
the 1920s through the early 1930's.
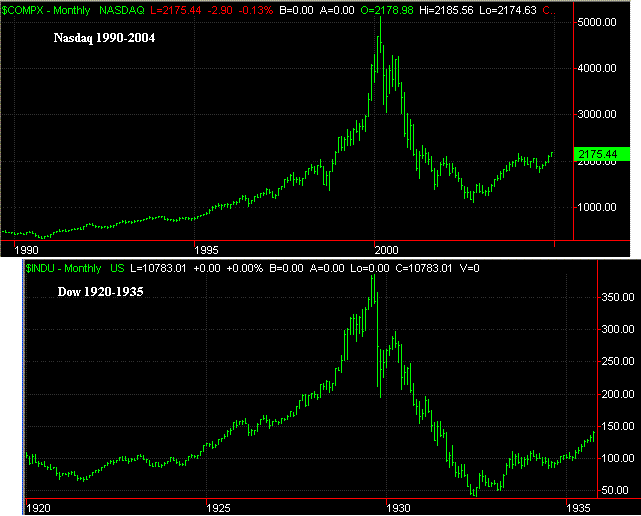
The question is will the Nasdaq continue to follow a similar
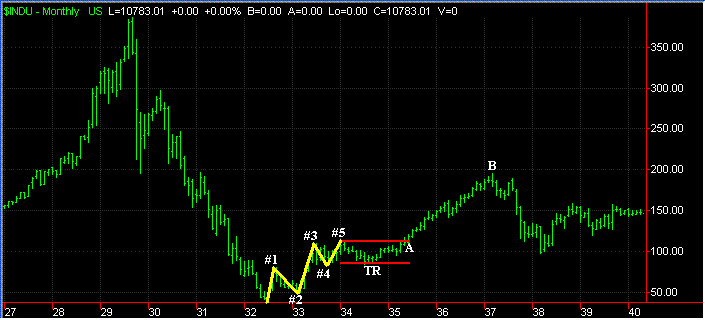
pattern in the years ahead like the Dow did in the mid to late 1930's? A
closer analysis of the Dow back in the early to mid 1930's shows that it
bottomed in the middle part of 1932 and then completed a 5 Wave Pattern in the
early part of 1934. This was then followed by a consolidation period from
1934 through the early part of 1935 as the Dow traded sideways. Then in
the middle part of 1935 the Dow broke out of its longer term trading range (TR)
and then was up strongly from the middle part of 1935 through the early part of
1937 (points A to B).
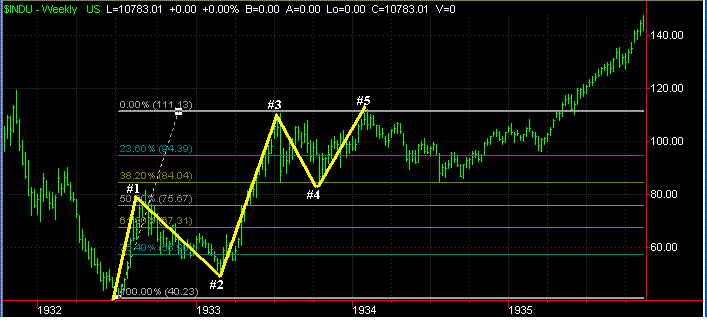
Meanwhile upon closer inspection after the Dow completed its 5
Wave Pattern it held support at its 38.2% Retracement Level while remaining a
trading range from 1934 through the early part of 1935. Also notice when
the Dow underwent its corrective 4th Wave in 1933 it held support at its 38.2%
Retracement Level as well.
Looking at the current chart of the Nasdaq it bottomed in the
late part of 2002 an appears to be exhibiting a potential 5 Wave Pattern as
well.
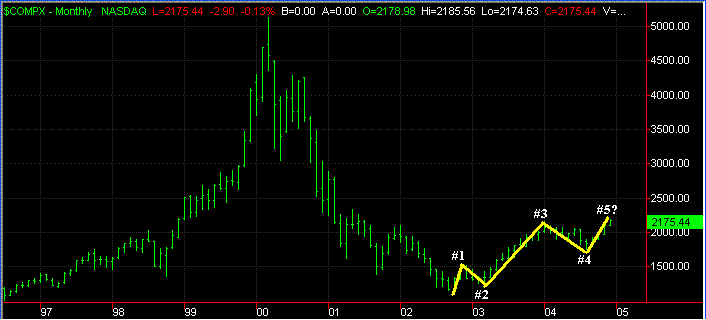
Meanwhile you will also notice that the Nasdaq held support near
its 38.2% Retracement Level while undergoing a corrective 4th Wave in 2004 much
like the Dow did in 1933.
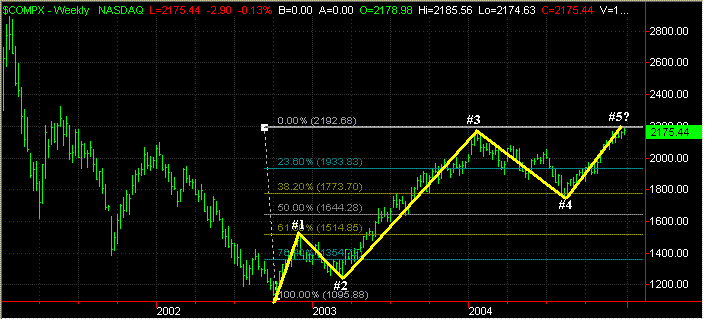
Thus the question remains is the Nasdaq nearing the completion
of its longer term 5 Wave Pattern and will it undergo a consolidation period
like the Dow did from 1934 through the early part of 1935 or will 2005 be a
strong performing year like has occurred in the past when the year has ended in
the number "5"?
If the Nasdaq is going to have a solid year in 2005 the one
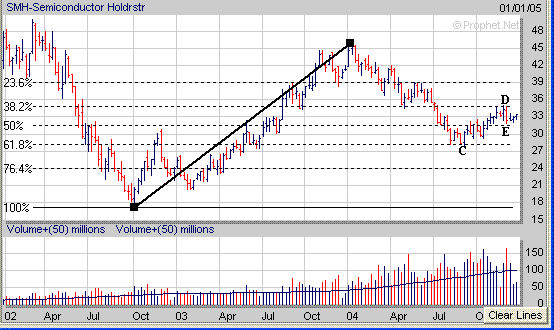
sector to watch is the Semiconductors. The Semiconductor Holders (SMH)
were very weak in 2004 however they did hold support at their longer term 61.8%
Retracement Level near 28 (point C). Meanwhile over the past month or so
the SMH's have been encountering resistance at their 38.2% Retracement Level
around 35 (point D) while holding support at their 50% Retracement Level near 32
(point E). If the Nasdaq is going to make a solid move upward in 2005 the
SMH's are probably going to have to break solidly above their 38.2% Retracement
Level near 35. Meanwhile if the SMH's drop below their 50% Retracement
Level near 32 then look for a retest of the September 2004 low near 28 (point C)
which would likely have an adverse affect on the Nasdaq.
Finally each year different Industry Groups will show strength
and outperform the previous year's leaders. A table comparing the best
performing Industry Groups in 2004 to those of 2003 is shown below. As you
can see new Industry Groups provided leadership in 2004 although some of the
leaders in 2003 still did well in 2004.
| Top
Yearly Performers (2004) |
2004 |
|
|
Return |
|
| Commercial
Services-Security |
110.7% |
|
| Textile-Household
Products |
102.5% |
|
| Steel-Producers |
85.1% |
|
| Computer-Security |
83.2% |
|
| Leisure-Gaming |
77.1% |
|
| Transportation-Air
Freight |
77.1% |
|
| Auto
& Truck-Tires |
76.0% |
|
| Computer-Desktop
Software |
72.9% |
|
| Transportation-Shipping |
69.9% |
|
| Medical-Outpatient/Home
Care |
67.8% |
|
|
|
|
|
2003 |
2004 |
| Top
Yearly Performers (2003) |
Return |
Return |
| Internet-Services |
169.0% |
44.8% |
| Computer-Imaging |
143.8% |
8.1% |
| Transportation-Heavy
Trucks/Parts |
129.3% |
7.5% |
| Communication-Fiber
Optic Equip |
126.1% |
12.9% |
| Machine-Metal |
125.8% |
25.0% |
| Computer-Medical |
115.4% |
18.7% |
| Electrical-Measuring
Instruments |
112.1% |
29.2% |
| Communication-Equipment |
104.1% |
46.2% |
| Retail/Wholesale-Food |
101.1% |
12.2% |
| Computer-Networks |
100.6% |
-11.9% |
Remember some things to pay attention to when looking for stocks
to invest in is their Sales and Earnings Growth, what Industry Group they reside
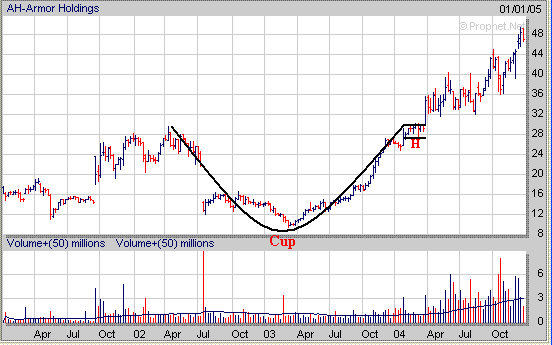
in and whether they are developing a favorable Chart Pattern. AH is stock in the Commercial Services-Security Industry Group
that exhibited strong
Sales and Earnings Growth in 2004. In addition AH developed a favorable
"Cup and Handle" chart pattern before breaking out in March of 2004.

Signup today for a 2
Week Trial Membership and have access to our Stocks
to Watch List which provides a list of Stocks that are exhibiting a
favorable Chart Pattern such as the "Cup and Handle". Also you
will receive our Daily Breakout Report
by email which Alerts you to Stocks that
are breaking out of a favorable Chart Pattern from our Stocks
to Watch List.
Click
Here to signup for a "Free" 2 Week Trial Membership
Amateur-Investor.net
|


