|
Weekend Stock Market Analysis
(1/21/06)
The rising price of Crude Oil and some unfavorable earnings reports from a few
big name companies really did a number on the market this week.
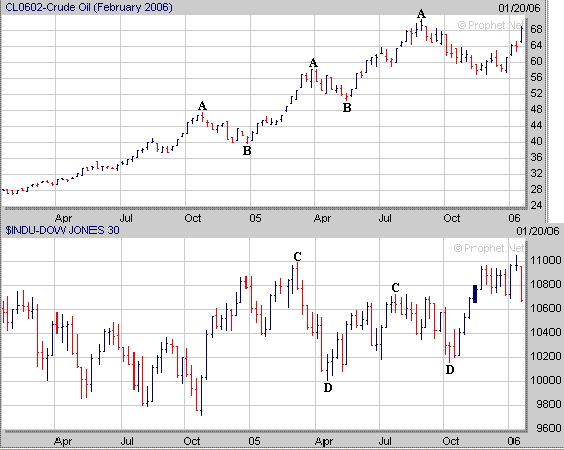
At this point it certainly looks like the price of Crude Oil is going to rise
back to its previous late August high just above the 70 level. The
question is once Crude Oil reaches the 70 level will it stall out or will it
continue to move higher over the next several weeks? Keep in mind
the last two times the price of Crude Oil went through a multi week correction
(points A to B) it then eventually rallied to a new 52 week high several weeks
later (points B to A) which had a negative affect on the Dow (points C to
D).
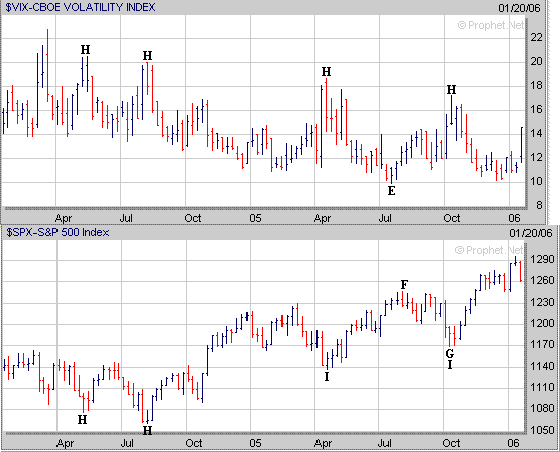
Meanwhile I also mentioned over the past few weeks that the Volatility Index (VIX)
was at a very low level which was a potential problem as investors had become
very complacent much like we saw last July (point E) before the
S&P 500 went through a correction (points F to G). On Friday the VIX
rose strongly as fear increased among investors however I don't think it has
risen to a high enough level yet like has occurred in the past (points H) when
the S&P 500 has put in a bottom (points I).
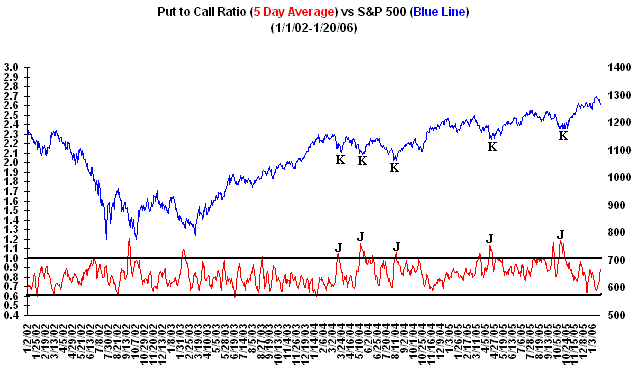
 Furthermore if we look at the 5 Day
Average of the Put to Call Ratio it has begun to rise as well however it still
hasn't risen above a value of 1.0 (points J) which in the past has signaled a
nearing bottom in the S&P 500 (points K). Thus although fear did
increase among investors this week so far neither the VIX or the 5 Day Average
of the Put to Call Ratio have reached an extreme level to signal a potential bottom.
 As far as the major averages the Dow
has now dropped below its 50 Day EMA (green line) and broken a previous support
area near 10700. With such a big drop on Friday in the Dow it's possible we
could see a minor bounce occur early next week. If a bounce does occur I
would look for the Dow to encounter upside resistance at its 50 Day EMA near
10800. Meanwhile if a bounce doesn't occur and the Dow continues lower its
next area of support would be at its 200 Day EMA (purple line) near 10600. 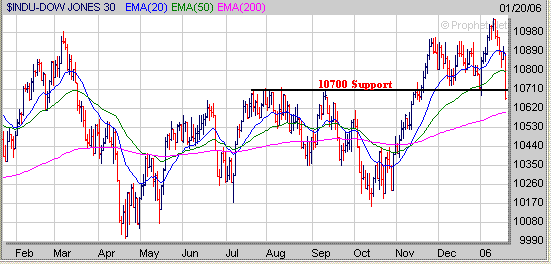
If the Dow fails to hold support at
its 200 Day EMA then this could eventually lead to a much bigger drop back to
the 10200 level which is where it found support at last October and further back
in July. Thus it will be very important for the Dow to hold support near
the 10600 level next week. 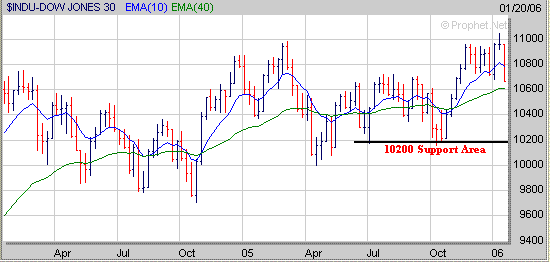
The Nasdaq has dropped back to its
50 Day EMA (green line) just above 2240 and it's possible we could see a bounce
occur early next week. If a bounce does occur I would expect the Nasdaq to
encounter upside resistance at its 20 Day EMA (blue line) near 2280.
Meanwhile if the Nasdaq fails to hold support at its 50 Day EMA and continues
lower then its next area of support would either be at the low made earlier this
month near 2190 (point L) or at its 200 Day EMA (purple line) near
2150. 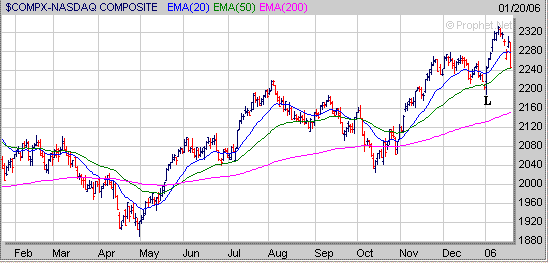
As far as the S&P 500 it also
has dropped back to its 50 Day EMA (green line) near 1260. If the S&P
500 does bounce off its 50 Day EMA early next week look for upside resistance to
occur at its 20 Day EMA (blue line) near 1275. Meanwhile if the S&P
500 is unable to hold support at its 50 Day EMA and continues lower its next
area of support would either be at the 1245 level (low made earlier this month)
or at its 200 Day EMA (purple line) just above 1220. 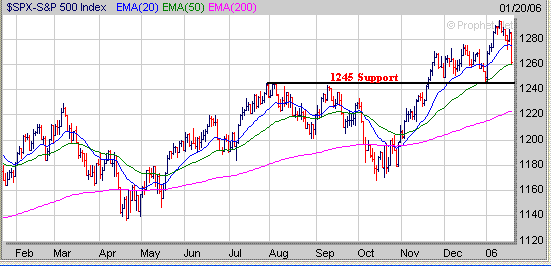
Now before we all start hitting the
panic button keep in mind the S&P 500 has been in an upward trending channel
since making a low in August of 2004 although it has been very choppy at
times. Thus until I see the S&P 500 break support at the bottom of its
rising upward channel which is currently around the 1190 level then its longer term up
trend will remain intact. 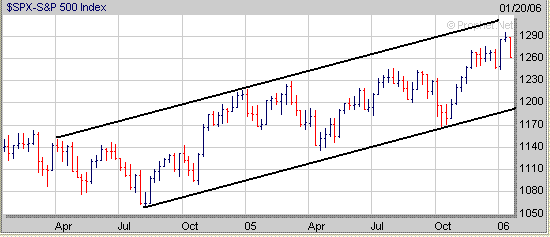
Finally
when the market is going through a correction it's important to start noticing
which stocks are holding up well versus those that aren't. For example
PARL from our Top 100 List has formed the right side of a 4 month Cup and now
needs to develop a Handle over the next few weeks to complete a Cup and Handle
pattern. 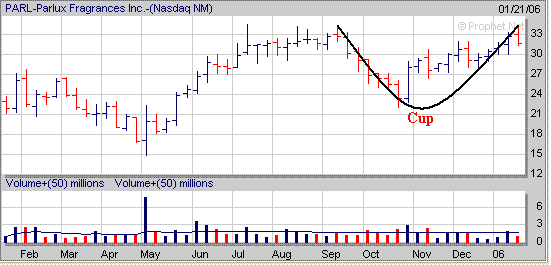
Meanwhile another
stock from our Top 100 List which has formed a 4 month Cup is MLR and it too
will need to work on developing a Handle over the next few weeks as
well. 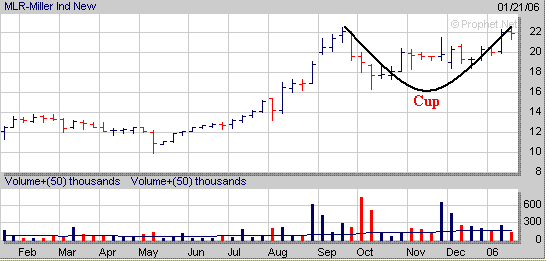
In 2005 our Long Term Investing Strategy finished up 31% while
our Short Term Investing Strategy ended up 64%.
Signup today for a "Free"
2 Week Trial Membership to amateur-investor.net and have access to
our current Stocks to Watch Buy List which contains stocks that are currently developing a favorable chart
pattern such as the Cup and Handle, Double Bottom and Flat Base which can be used with either our Long Term
Investing Strategy or Short Term Investing
Strategy.
Also you will have access to these other investment products.
Daily Breakout Reports
Market Timing Indicator
Weekly ETF Buy and Short Signals
Click
Here to Signup for a "Free" 2 Week Trial Membership
Send this Free Newsletter to a Friend or Relative
Amateur-Investor.net
|


