|
Click
Here to Signup for a Free Trial Membership and have access to
our Stocks to Watch List and Daily Breakout Reports
Weekend Stock Market Analysis
(1/22/05)
Although 2005 has started out well, from a longer term point of
view, the major averages had rallied significantly after making a bottom in
October of 2002. In October of 2002 the Dow was around 7200, the Nasdaq
near 1100 and the S&P 500 was around 770. Meanwhile by late 2004 the
Dow was near 10900, the Nasdaq was around 2190 and the S&P 500 near
1220. Thus over a span covering a little more than two years the Dow had
gained 51%, Nasdaq nearly 100% and the S&P 500 around 58%.
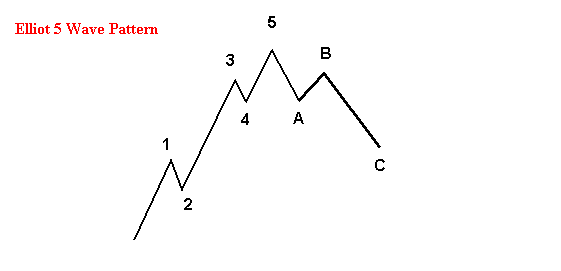
As I have talked about before it does appear the major averages
may be completing an Elliot 5 Wave Pattern and we are beginning to see the early
stages of an ABC correction. Once again for those not familiar with what
an Elliot 5 Wave Pattern looks like a simple chart is shown below. Notice
after the 5 Wave Pattern completes itself this is followed by an extended ABC
correction.
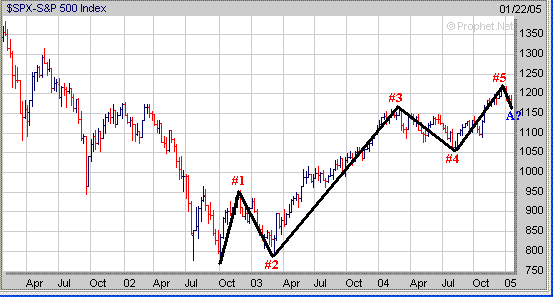
If we look at a longer term chart of the S&P 500 it does
show some similar characteristics to the chart above.
In the near term the major averages
are rather oversold and we will probably see a sharp oversold bounce occur
at some point. Over the past year when the %K Line associated with
the Slow Stochastics has dropped to 20 or below (points A) this has been a
fairly reliable signal of a potential bounce from oversold conditions (points B)
as shown by the weekly chart of the Nasdaq below. So this is something I
will be watching for over the next week or two. 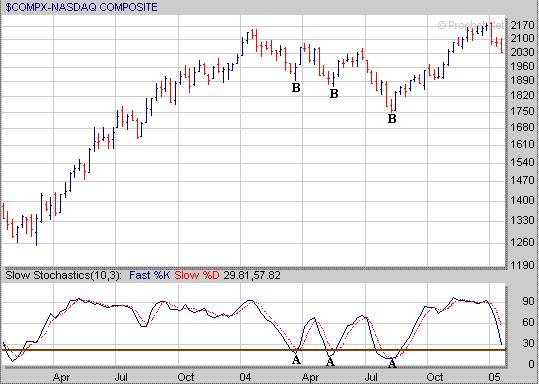
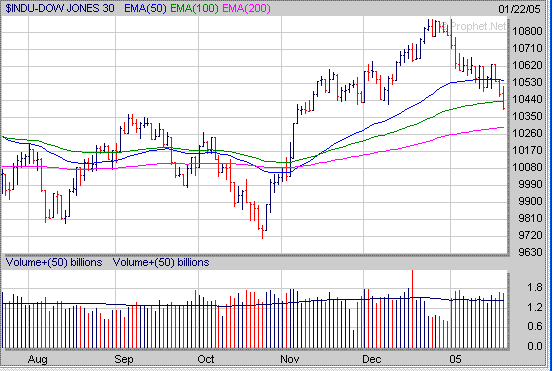
As
far as the major averages the Dow failed to hold support at its 100 Day EMA
(green line) near 10440 last week and its next major support area is at its 200
Day EMA (purple line) near 10300.
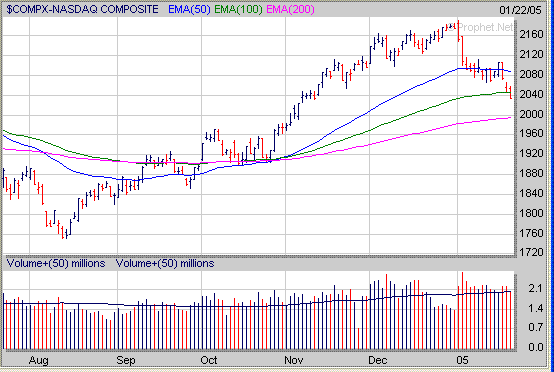
The
Nasdaq has failed to hold support at its 100 Day EMA (green line) last week just
above 2040. The next major support level for the Nasdaq is at its 200 Day
EMA (purple line) near 2000.
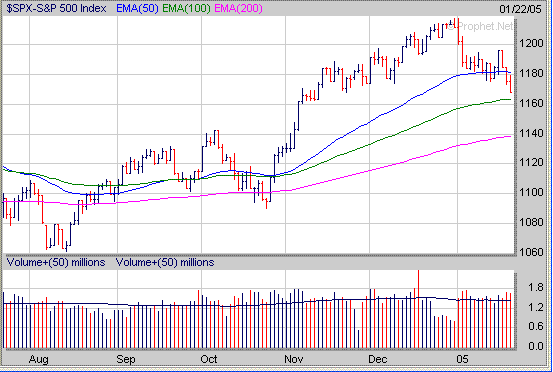
As far as the S&P 500 it still remains above its 100 Day EMA
(green line) which is just above 1160. If the S&P 500 fails to hold
support near 1160 then its next major support area would be at its 200 Day EMA
near 1140.
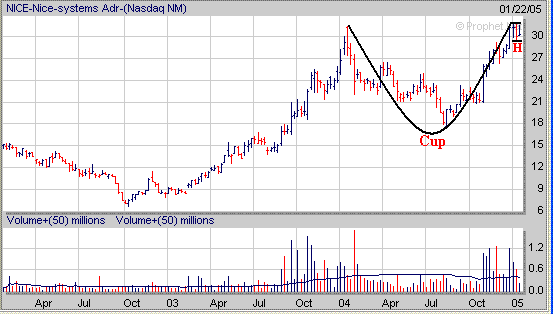
Although the market hasn't started out well in 2005 continue to
maintain a list of stocks which are acting well and developing a favorable chart
pattern. NICE from our Stocks to Watch List has now developed a small
constructive 3 week Handle (H) after forming a Cup.
Signup today for a 2
Week Trial Membership and have access to our Stocks
to Watch List which provides a list of Stocks that are exhibiting a
favorable Chart Pattern such as the "Cup and Handle", "Double
Bottom" and "Flat Base". Also you
will receive our Daily Breakout Report
by email which Alerts you to Stocks that
are breaking out of a favorable Chart Pattern from our Stocks
to Watch List.
Click
Here to signup for a "Free" 2 Week Trial Membership
Amateur-Investor.net
|


