|
Signup
today for a "Free" 2 Week Trial Membership
which includes our Stocks to Watch List and Daily Breakout Reports
Weekend Stock Market Analysis
(1/24/04)
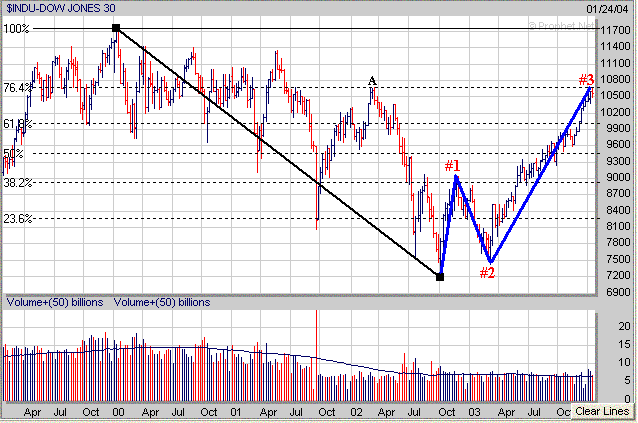
The major averages especially the Dow and S&P 500 appear to
be encountering some upside resistance at those longer term levels I mentioned
last week which were near 10700 (Dow) and just above 1150 (S&P 500).
Remember the 10700 level in the Dow coincides with its longer term 76.4%
Retracement Level (calculated from the early 2000 high to the October 2002 low)
and was also the high made in 2002 (point A). Meanwhile the Dow is still
exhibiting a Wave #3 pattern for those of you that follow Elliot Wave Theory and
I would suspect that a corrective 4th Wave will occur before much longer.
Once again for those not familiar with Elliot
Wave Theory a simple example is shown below. Notice how Waves 1,3
and 5 are upward moves with Wave 3 lasting the longest while Wave 5 is the
shortest. Meanwhile notice that Waves 2 and 4 are corrective Waves
which only last for a brief period of time before the upward trend continues. 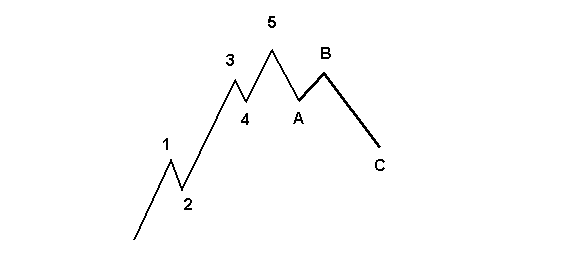
As
mentioned above the S&P 500 is getting close to a longer term upside
resistance zone at its 50% Retracement Level (calculated from the early 2000
high to the October 2002 low) just above 1150. The S&P 500 also is
exhibiting a Wave #3 pattern and eventually will undergo a corrective 4th Wave
as well. 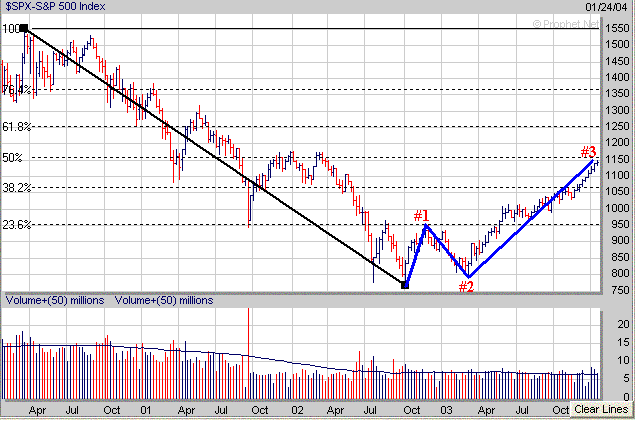
The Nasdaq is also exhibiting a Wave
#3 pattern which began in March of 2003 and broke through a significant
resistance zone at its longer term 23.6% Retracement Level near 2050 a few weeks
ago. 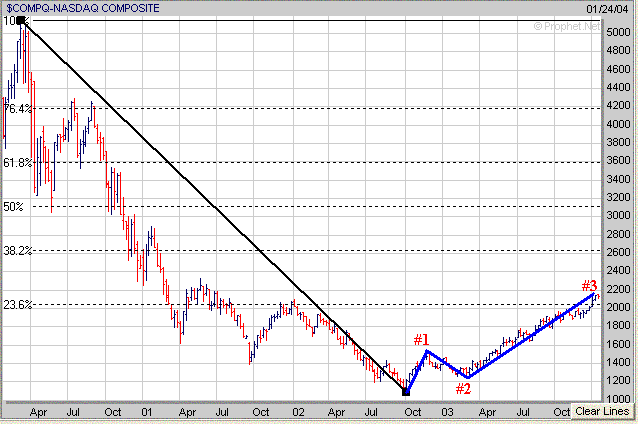
Looking at the shorter term the Dow
has been able to hold support above its 20 Day EMA (blue line) since early
December. If the Dow breaks below its 20 Day EMA near 10450 then look for
a quick drop back to its 50 Day EMA (green line) near 10200. As I have
pointed out in the past, since last May, the Dow has found support near its 50
Day EMA on several occasions (points B, C, D, E, F and G) while remaining in an
up trend. 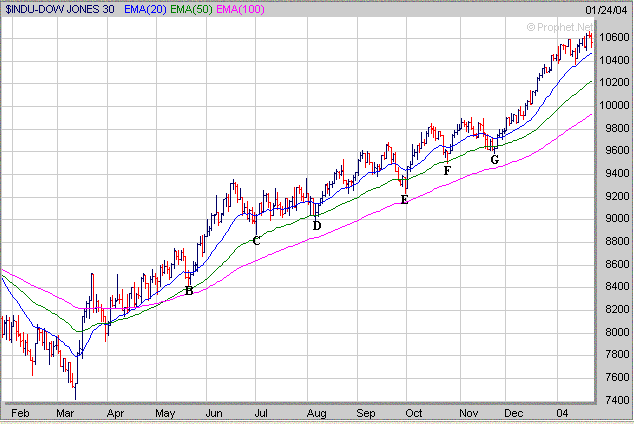
The Nasdaq is
still well above its 20 Day EMA (near 2175) and this is where I would expect
initial support if more selling pressure develops. If the Nasdaq drops
below its 20 Day EMA then its next area of support to the downside would be near
its 50 Day EMA around the 2010 level. As you can see since last May the
Nasdaq has also been finding support near its 50 Day EMA (points H, I, J, K and
L) as it has remained in an up trend. 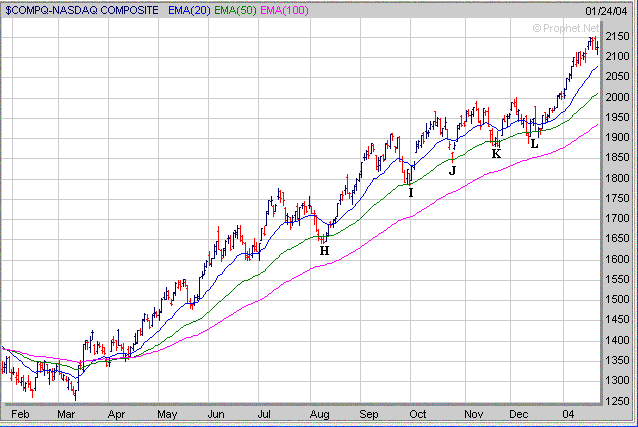
The S&P 500 is still well above
its 20 Day EMA (near 1120) and this is where I would look for initial support if
a pullback develops. If the S&P 500 drops below its 20 Day EMA then
its next level of support to the downside would be at its 50 Day EMA near
1095. 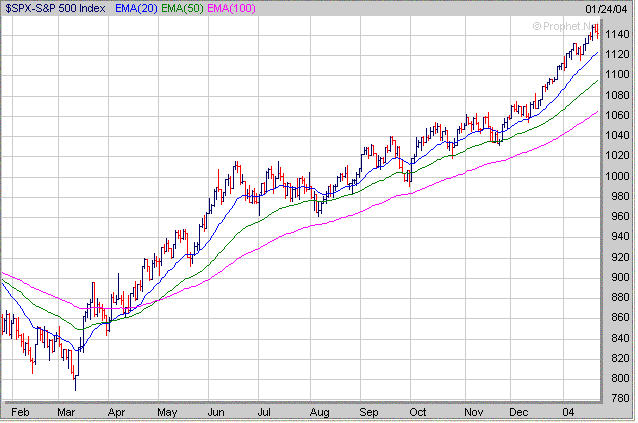
Meanwhile
as I have mentioned over the past few weeks keep a close eye on the
Semiconductor sector. A chart of the Semiconductor Holders (SMH) shows
that on a weekly basis they are nearing their 10 Weekly EMA (same as 50 Day EMA
on a daily basis) just above 42. If the SMH's fail to hold support at
their 10 Weekly EMA (blue line) then they will likely drop back to their 20
Weekly EMA (green line) near 40.50. The 20 Weekly EMA is a key support
area as the SMH's have held support near this EMA since last April. 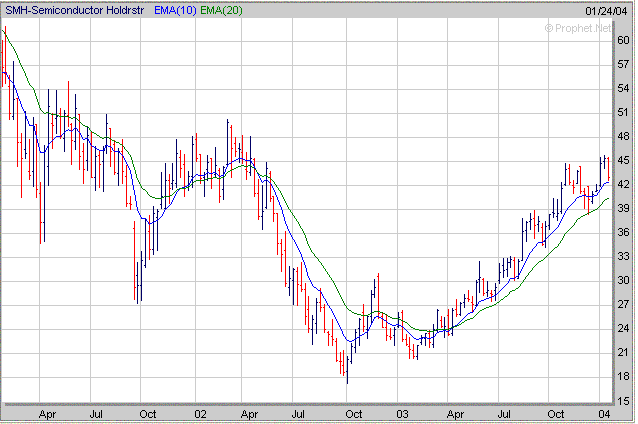 Some
of you have asked me about the current readings involving the Volatility
Index. A 10 year plot of the S&P 500 versus the VXO is
shown below. At least since the late 1990's when the VXO has dropped below
a reading of 20 this has signaled an extreme amount of complacency in the market
which has been followed by some type of sell off (points M). However over
the past few months the VXO has remained below 20 for and extended period of
time and is currently at a level (point N) not seen since 1996. So far the
extremely low readings in the VXO have not led to a major sell off like we have
seen on 5 separate occasions since the late 1990's. 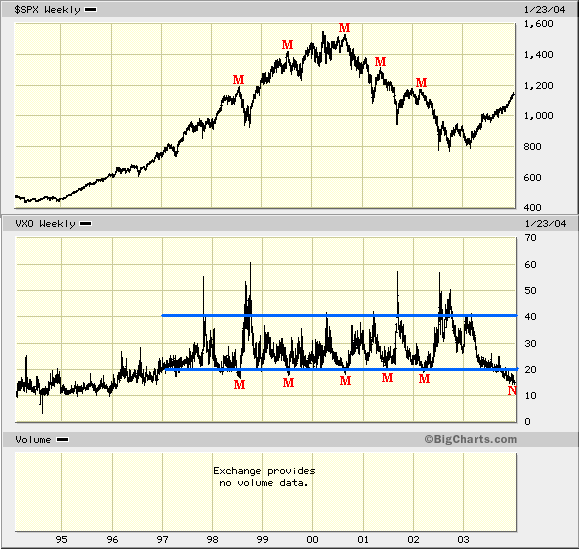
Now if we look at longer term plot of
the VXO (old VIX), going back to its inception in 1986, shows that there was quite
a bit of volatility from 1986 through 1991 which was then followed by a period
of low volatility from 1992 through 1997. This was then followed by a
higher amount of volatility from 1998 through 2003. I suppose the question
could be raised is the VXO headed back into an extended period of low volatility
like occurred in the 1992 to 1997 timeframe? Another thing to keep in mind
is that the S&P 500 traded nearly sideways from 1992 through 1994 (points O
to P) and only gained around 100 points during that 3 year period of rather low
volatility. 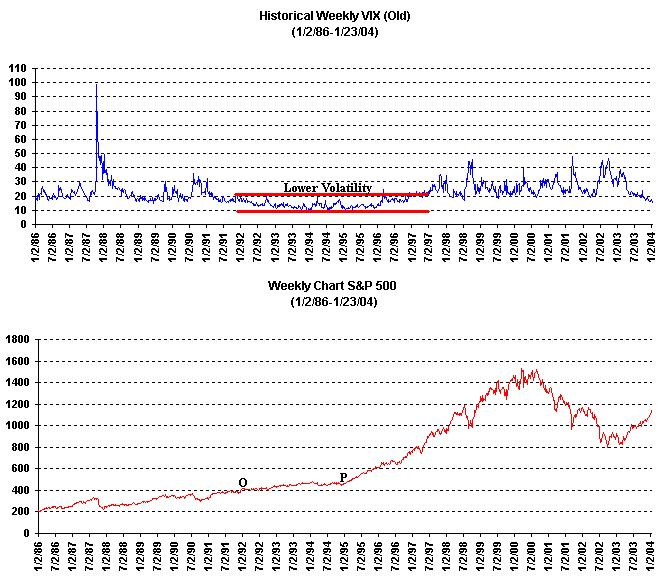
Finally when considering which
stocks to invest focus on those that are experiencing increasing Sales and
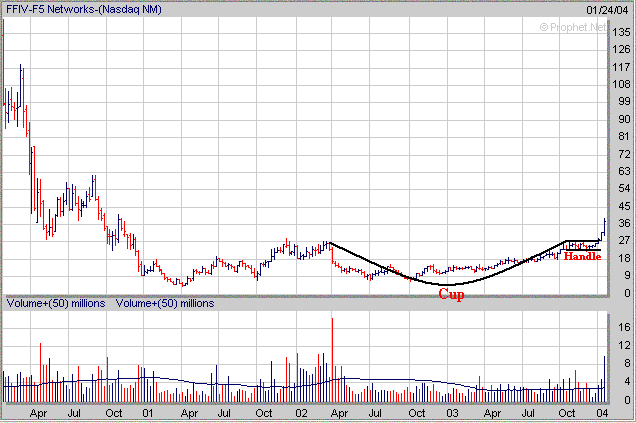
Earnings Growth which are breaking out of a favorable chart pattern. FFIV
is another example of a stock which has been seeing an increase in Sales and
Earnings Growth over the past few quarters Also note that FFIV formed a
"Cup and Handle" pattern before breaking out two weeks ago accompanied
by increasing volume. 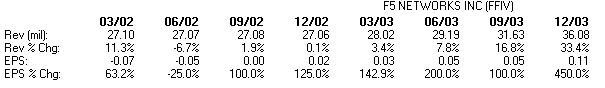
How can a Premium Membership to amateur-investor.net
benefit you as an investor? We focus on stocks which are exhibiting
favorable Sales and Earnings Growth that have developed a favorable chart pattern such as a "Cup and Handle",
"Double Bottom" or "Flat Base". These stocks are then
included in our "Stocks to Watch List" which gives investors a
quick reference to those stocks which may provide the best buying opportunities in the weeks ahead. Each stock in
our "Stocks to Watch List"
includes specific Buy Prices, Stop Loss Prices (very important) and projected
Target Prices.
Signup
Today for a "Free" Trial Membership and see our complete list of
Stocks
which are currently developing a favorable Chart Pattern such as the
"Cup and Handle" or "Double Bottom"
Amateur-Investor.net
|

