|
Weekend Stock Market Analysis
(1/28/06)
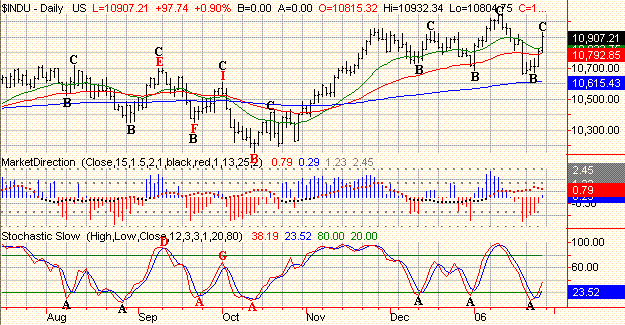
The major averages bounced this week as they had become somewhat
oversold on a daily basis as shown by our Market Timing Indicator (MTI)
below. Generally when the %K Line (red line) in association with the Slow Stochastics
drops below a reading of 20 (points A) the market will usually undergo a bounce
(points B to C) after becoming oversold. Of course the question is will
this bounce eventually stall out leading to another round of selling or will it
follow through and allow for the major averages to rally above the levels they
reached just a few weeks ago. The current pattern of the Slow
Stochastics looks similar to what occurred last Fall when the %K Line fell
sharply (points D to A) as the Dow sold off (points E to F). This was then
followed by a bounce in the Dow (points F to I) as the %K Line rose around 70 (points A to G).
Meanwhile the Dow eventually stalled out which was then followed by more selling pressure (points I to B)
as the %K Line dropped back below 20 once again (points G to A). Thus it
will be interesting to see what transpires in the Dow next week over the next
week or so.
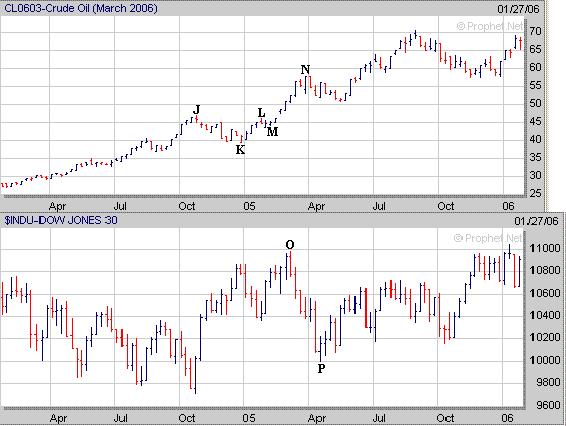
 Meanwhile the price
of Crude Oil pulled back a little bit this week and is acting similar to what
occurred from late 2004 into the early part of 2005. In late 2004 the price of Crude Oil
made a bottom after going through a correction from from late October through
December (points J to K) which was then followed by a four week rally (points K
to L). Next the price of Crude Oil pulled back over the next two weeks (points K to
M)
before making another significant move higher in February and March (points M to
N). Meanwhile as you can see below once the price of Crude Oil began to
make a new high the Dow eventually came under strong selling pressure (points O to
P). Thus if the price of Crude Oil were to eventually rise into the 70's this would likely have a negative impact on the
Dow in the longer term.
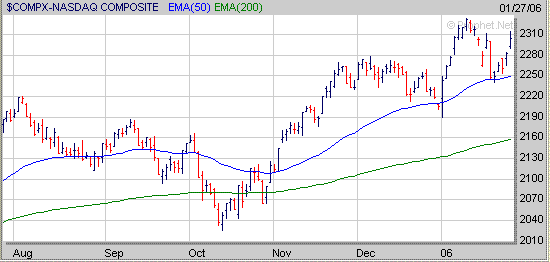
 As far as the major
averages the Nasdaq held support at its 50 Day EMA (blue line) on Monday and
then rallied the rest of the week. If the Nasdaq continues to the upside next week it may encounter resistance at its intra day high made a few
weeks ago just above 2330. Meanwhile if the Nasdaq begins to stall out and then comes under some selling pressure look for
support at its 50 Day EMA near 2250.
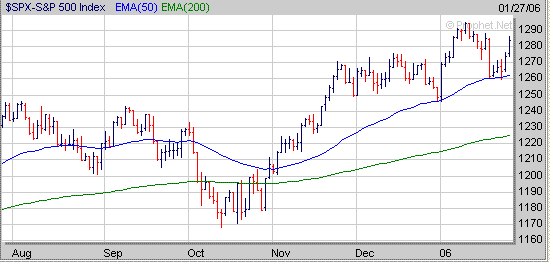
 The S&P 500
also held support early in the week at its 50 Day EMA (blue line) near 1260 and
then rallied Thursday and Friday. If the S&P 500 continues higher next week it may encounter upside resistance at its previous intra day
high made a few weeks ago near 1295. Meanwhile if the S&P stalls out
near its current level and then comes under some selling pressure look for
support once again at its 50 Day EMA near 1260.
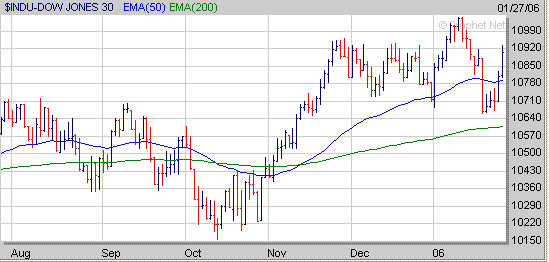
 As
far as the Dow it rallied
strongly Thursday and Friday and is back above its 50 Day EMA (blue line).
If the Dow is able to continue higher next week look for upside resistance at
its intra day high made a few weeks ago just above 11000. Meanwhile if the
Dow begins to stall out and comes
under selling pressure look for initial support at its 50 Day EMA just below
10800.
 Finally
when looking for stocks to invest in focus on those that are breaking out of a
favorable chart pattern. Over the past year ARD has formed two Cup and
Handle patterns of differing lengths before moving higher. If investors
missed the initial Cup and Handle breakout last September they were given a
second opportunity as ARD broke out of a second Cup and Handle pattern earlier
this month. 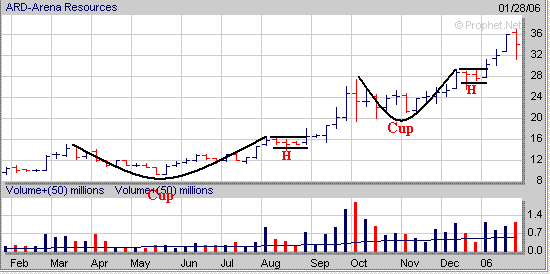
In 2005 our Long Term Investing Strategy finished up 31% while
our Short Term Investing Strategy ended up 64%.
Signup today for a "Free"
2 Week Trial Membership to amateur-investor.net and have access to
our current Stocks to Watch Buy List which contains stocks that are currently developing a favorable chart
pattern such as the Cup and Handle, Double Bottom and Flat Base which can be used with either our Long Term
Investing Strategy or Short Term Investing
Strategy.
Also you will have access to these other investment products.
Daily Breakout Reports
Market Timing Indicator
Weekly ETF Buy and Short Signals
Click
Here to Signup for a "Free" 2 Week Trial Membership
Send this Free Newsletter to a Friend or Relative
Amateur-Investor.net
|

