|
Click
Here to Signup for a Free Trial Membership and have access to
our Stocks to Watch List and Daily Breakout Reports
Weekend Stock Market Analysis
(1/29/05)
All three major averages attempted to bounce early in the week
from oversold conditions but came under selling pressure by the end of the
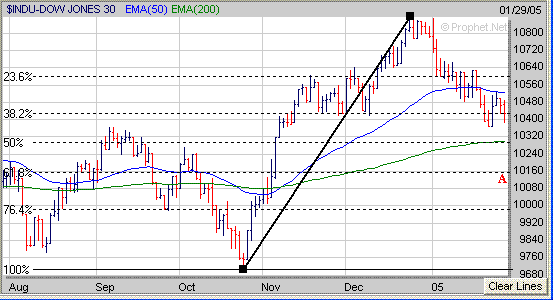
week. The Dow encountered resistance at its 50 Day EMA (blue line) near
10530 as it tried to bounce. The key short term support level to watch in
the Dow is near 10300 which coincides with its 200 Day EMA (green line) and 50%
Retracement Level (calculated from the October low to its late December
high). If the Dow breaks below 10300 then its next support area would be
at its 61.8% Retracement Level near 10160 (point A). Meanwhile if the Dow
attempts to rally look for initial resistance at its 50 Day EMA near
10530.
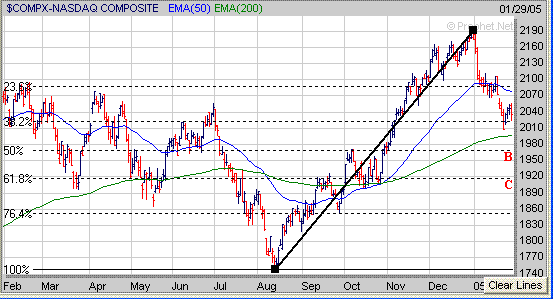
The Nasdaq rallied for three days
but then came under more selling pressure on Friday. The key short term
support level to watch in the Nasdaq is at its 200 Day EMA (green line)
near 2000. If the Nasdaq is unable to hold support near 2000 then the next
level of support would either be at its 50% Retracement Level (calculated
from the August low to the late December high) near 1970 (point B) or at its
61.8% Retracement Level near 1920 (point C). Meanwhile if the Nasdaq
attempts to rally look for upside resistance at its 50 Day EMA (blue line) near
2075.
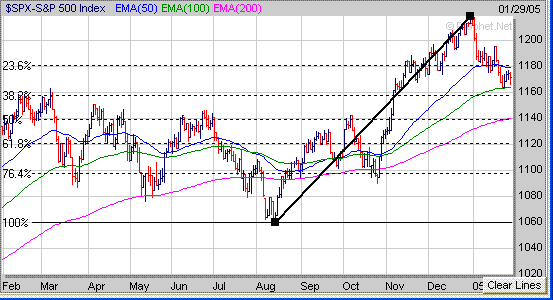
The S&P 500 also attempted to
bounce for three days this past week but was unable to break above its 50 Day
EMA (blue line) near 1180. In the near term the S&P 500 has a key
support level in the 1158 to 1163 area which coincides with its 38.2%
Retracement Level (calculated from the August low to the late December high) and
100 Day EMA (green line). If the S&P 500 drops below 1158 its next
area of support would be at 1140 which coincides with its 200 Day EMA (purple
line) and 50% Retracement Level. Meanwhile if the S&P 500 attempts to
rally early next week look for initial resistance at its 50 Day EMA near
1180.
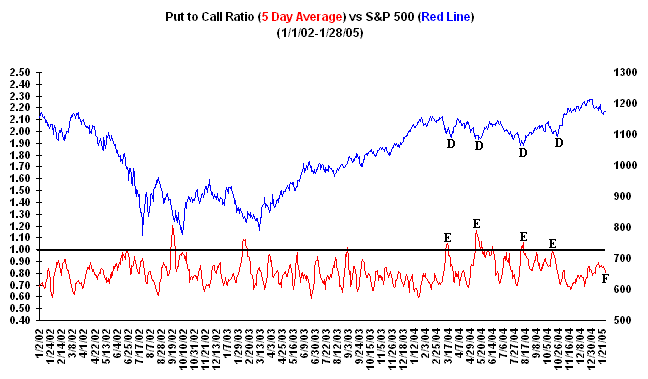
Despite
the major averages undergoing a correction this month there still hasn't been
much fear generated yet among investors. If we take a look at the 5 Day
Average of the Put to Call Ratio the last four times the S&P 500 made a
bottom (points D) and then rallied strongly from oversold conditions was when
the 5 Day Average of the put to Call Ratio rose to at least a value of 1.0
(points E). So far not much fear has been shown by investors as the
current 5 Day Average of the Put to Call Ratio (point F) is still well below
1.0.
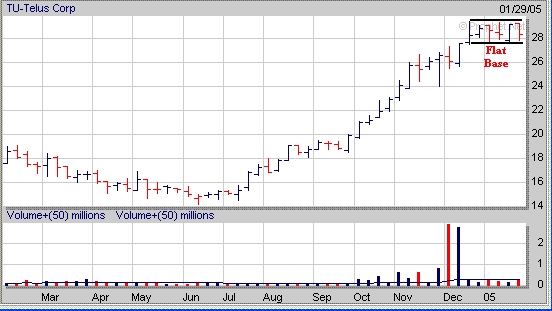
Finally there are three basic
chart patterns I look for when screening for stocks to put in my watch list such
as the "Cup and Handle", "Double Bottom" and "Flat
Base". Typically the Flat Base pattern will form after a stock has
already made a strong move upward and then consolidates its gains while
developing a trading range. Here is a current example from my Stocks to
Watch List. TU rallied strongly from late September through mid December
and has been trading sideways over the past six weeks between $27.50 and $29.50
while developing a Flat Base as the market has gone through a correction.
What I will be watching for in the weeks ahead is for TU to break out of its
Flat Base (trading range) to the upside accompanied by good volume.
Signup today for a 2
Week Trial Membership and have access to our Stocks
to Watch List which provides a list of Stocks that are exhibiting a
favorable Chart Pattern such as the "Cup and Handle", "Double
Bottom" and "Flat Base". Also you
will receive our Daily Breakout Report
by email which Alerts you to Stocks that
are breaking out of a favorable Chart Pattern from our Stocks
to Watch List.
Click
Here to signup for a "Free" 2 Week Trial Membership
Amateur-Investor.net
|


