|
Signup
today for a "Free" 2 Week Trial Membership
which includes our Stocks to Watch List and Daily Breakout Reports
Weekend Stock Market Analysis
(1/31/04)
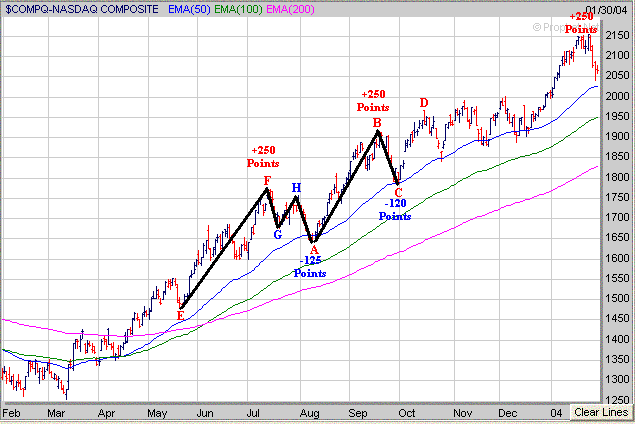
The Nasdaq which gained roughly 250 points from the early
December low to the high made just over a week ago has encountered some selling
pressure and dropped about 100 points this past week. Over the past year
there have been two other occurrences in which the Nasdaq gained 250 points or
more and then went through a 100 to 125 point correction. The first one
occurred last Summer when the Nasdaq gained 250 points from early August through
mid September (points A to B) and then went through a quick 120 point correction
(points B to C). In this case the Nasdaq found support at its 50 Day EMA
(blue line) and then eventually rallied to a new high (points C to
D). The second occurrence happened last Spring when the Nasdaq
rallied over 250 points from mid May to the early part of July (points E to F)
which was then followed by a 125 point drop (points F to A). Notice in
this that the Nasdaq also found support near its 50 Day EMA (blue line) before
making another substantial run higher (points A to B). Also take
note that after the Nasdaq initially sold off (points F to G) it rallied for
about a week (points G to H) before making another strong move downward in early
August leading to a bottom (points H to A). The
question is will we see a similar scenario develop this time around in the
Nasdaq like occurred last Spring and Summer when it dropped back to its 50 Day
EMA and then eventually rallied to new highs?
Meanwhile both the Dow and S&P 500 have run into some
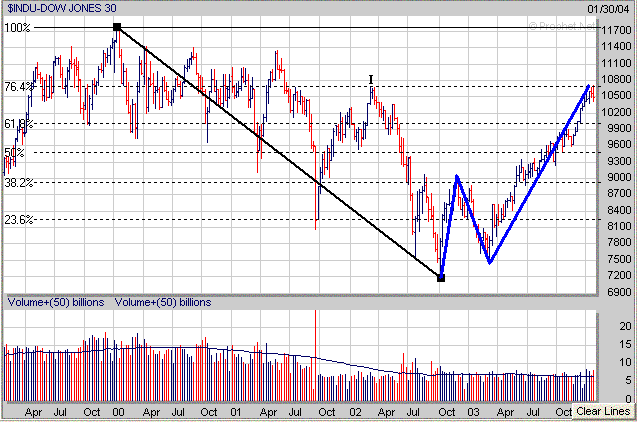
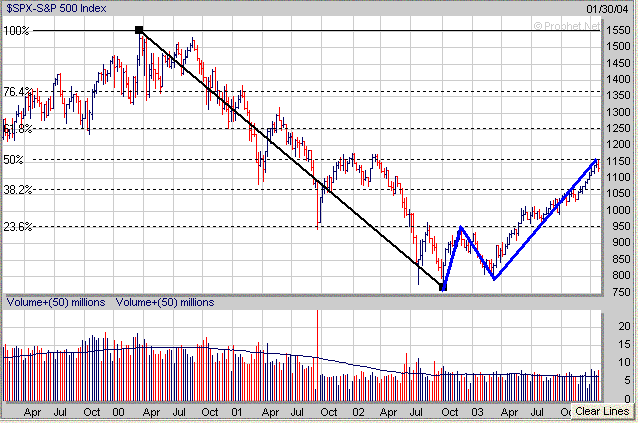
resistance at specific longer term Retracement Levels. The Dow's 76.4%
Retracement Level was right at 10700 which also corresponded to the high made in
2002 (point I). As for the S&P 500 it ran into resistance at its 50%
Retracement Level in the 1155-1160 area.
For those that follow Elliot Wave Theory the question is will we
now see a corrective 4th Wave develop over the next few weeks before getting one
more upside move to complete the final 5th Wave?
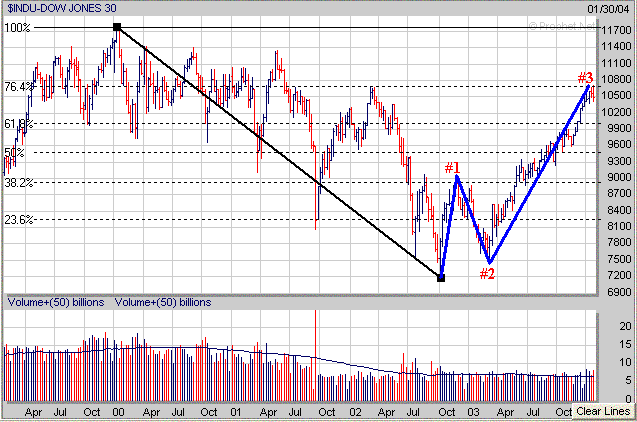
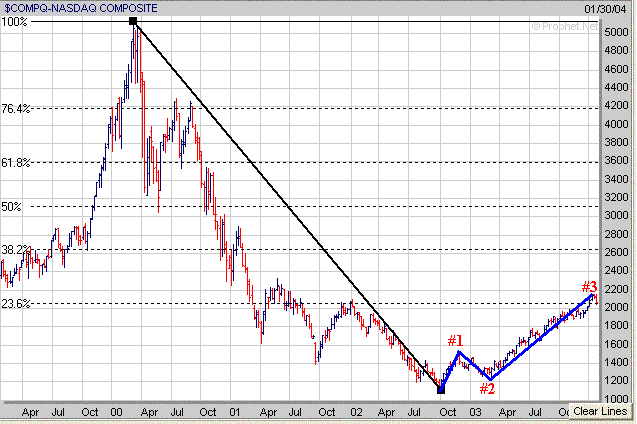
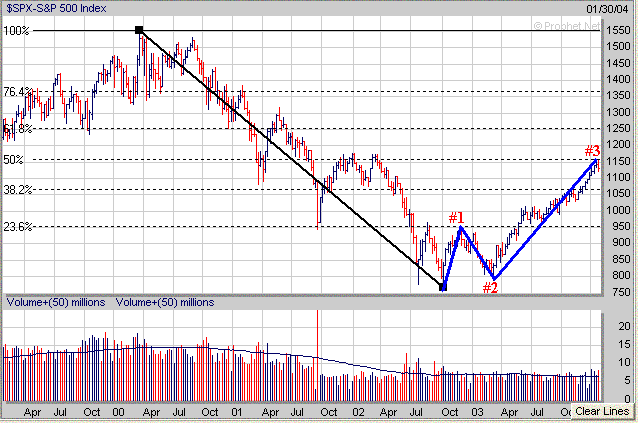
Once again for those not familiar with Elliot
Wave Theory a simple example is shown below. Notice how Waves 1,3
and 5 are upward moves with Wave 3 lasting the longest while Wave 5 is the
shortest. Meanwhile notice that Waves 2 and 4 are corrective Waves
which only last for a brief period of time before the upward trend continues. 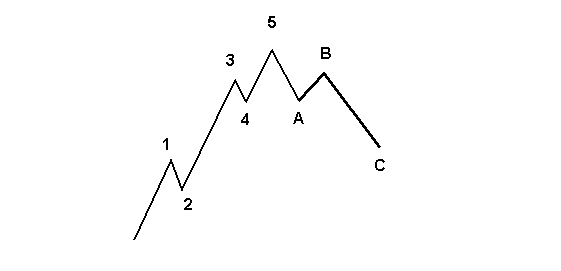
As
far as the near term the Dow so far has been holding support near its 20 Day EMA
(blue line). If it comes under some more selling pressure look for the
next area of support at its 50 Day EMA (green line) near 10275. Meanwhile
if the Dow reverses to the upside look for resistance at the 10700 level. 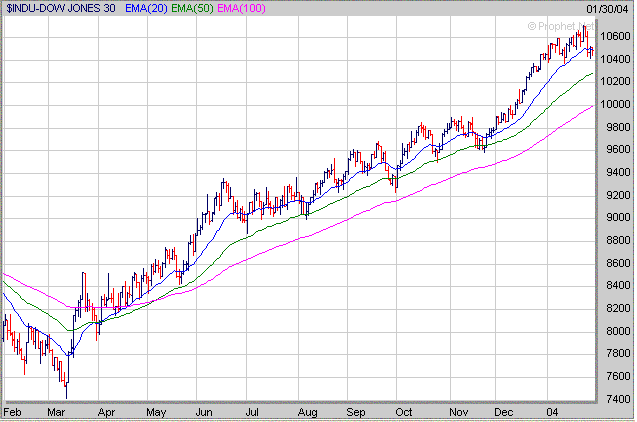
The
Nasdaq has fallen below its 20 Day EMA (blue line) but is still holding above
its 50 Day EMA (green line) near 2030 so that will be a critical support area to
watch next week. If the Nasdaq reverses to the upside look for resistance
near the 2150 area. 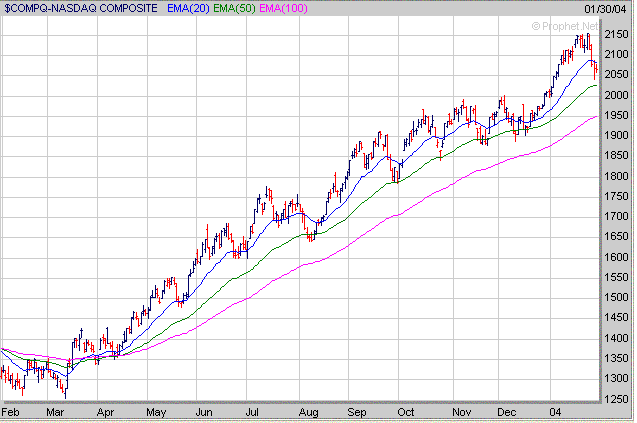
The
S&P 500 is holding support so far near its 20 Day EMa (blue line). If
the S&P 500 comes under more selling pressure look for its next area of
support at its 50 Day EMA (green line) near 1105. Meanwhile if the S&P
500 reverses to the upside look for resistance near the 1155 area. 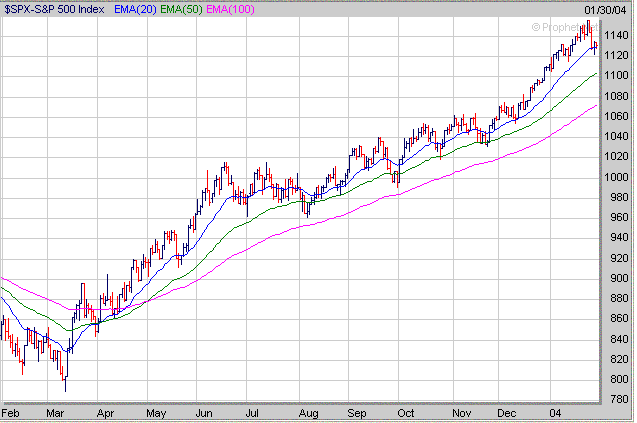
Looking
at a 5 day chart of the Nasdaq on a 30 minute basis shows that it could make a
substantial move on Monday as it has formed a triangle pattern. If it
breaks out of this triangle pattern to the upside I would expect the Nasdaq to
rally up to either its shorter term 38.2% or 50% Retracement Levels near 2084
(point J) and 2097 (point K) respectively. Meanwhile if the Nasdaq breaks
to the downside instead I would expect a quick drop back to Thursday's intra day
low near 2040. 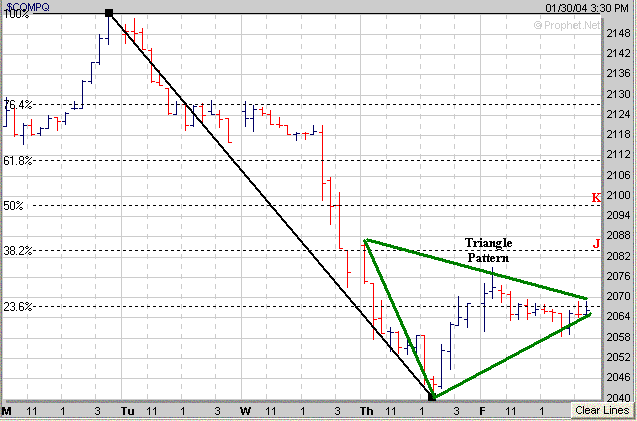
Meanwhile keep a close eye on the
Semiconductors Holders (SMH) as they have have dropped just below their 50 Day EMA
(blue line). The SMH's appear to have a key support area near the 40 level
which is at their 100 Day EMA (green line) and also is along their longer term
upward sloping trend line (black line) from the February low. If the SMH's
break below 40 this would be an ominous sign not only for the Semiconductors but
for the rest of the market as well. 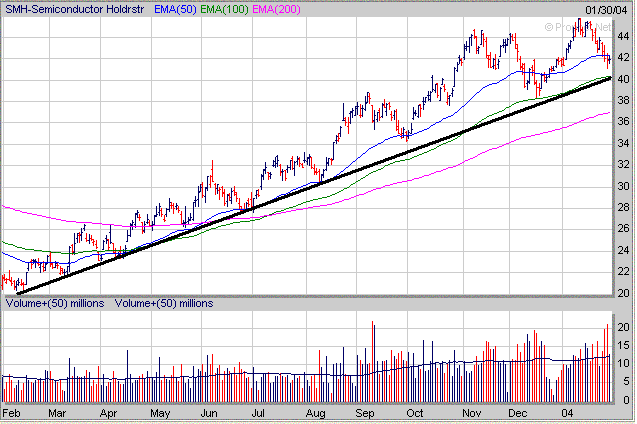
Finally
when looking for stocks to invest in focus on those that are developing a
favorable chart pattern such as the "Cup and Handle". TASR
provides a good example of a stock which formed the right side of a
"Cup" from May of 2002 through August of 2003. After forming a
"Cup" TASR then developed a 5 week "Handle" (H) before
breaking out last September on above normal volume (point L). 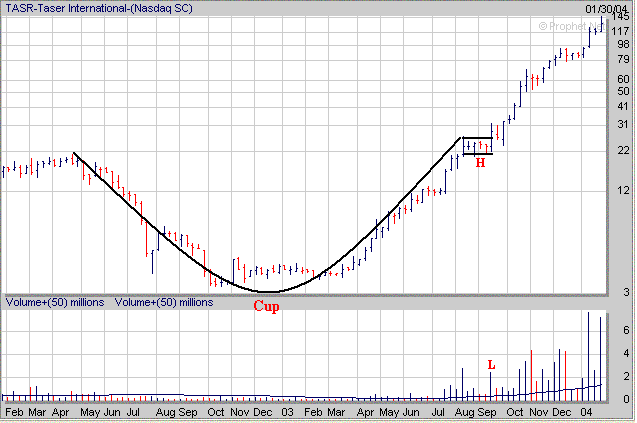
When the market is
in a corrective phase that gives you an excellent opportunity to start noticing
which stocks are holding up well and forming a favorable chart pattern versus
those that aren't. Thus when the market does begin to turnaround those
stocks which break out first will likely become the next market leaders. How can a Premium Membership to amateur-investor.net
benefit you as an investor? We focus on stocks which are exhibiting
favorable Sales and Earnings Growth that have developed a favorable chart pattern such as a "Cup and Handle",
"Double Bottom" or "Flat Base". These stocks are then
included in our "Stocks to Watch List" which gives investors a
quick reference to those stocks which may provide the best buying opportunities in the weeks ahead. Each stock in
our "Stocks to Watch List"
includes specific Buy Prices, Stop Loss Prices (very important) and projected
Target Prices.
Signup
Today for a "Free" Trial Membership and see our complete list of
Stocks
which are currently developing a favorable Chart Pattern such as the
"Cup and Handle" or "Double Bottom"
Amateur-Investor.net
|


