|
Click
Here to Signup for a Free Trial Membership and have access to
our Stocks to Watch List and Daily Breakout Reports
Weekend Stock Market Analysis
(1/8/05)
Last week I mentioned that since 1900 when the year ends in
the number "5" the Dow has always been up significantly.
Meanwhile I'm also sure some of you have heard that the market's performance in
January will give a clue to how the year will end up. Well I went back and
researched that this week and here is a quick breakdown. Since 1928 there
have been 52 times when the month of January has had a positive return for the
Dow. Out of those 52 years 42 of them (81%) saw the Dow having a positive
return for those years while 10 of them (19%) didn't. Meanwhile when the Dow
had a negative return during the month of January which has occurred 24 times
sine 1928 the Dow had a negative return for the year on 16 occasions (67%) while
the other 8 occurrences (33%) ended up having a positive return. Thus from
a statistical standpoint since 1928 there is a rather high probability than when
the Dow has a positive return in the month of January that the year will end up
positive as well 81% of the time. Of course there will always be some
exceptions however I was actually surprised to see such a high
percentage.
At any rate so far 2005 hasn't started out well as the major
averages came under some pretty strong selling pressure this week. The Dow
has dropped back to its 23.6% Retracement Level (calculated from the late
October low to the late December high) however it still remains just above its
50 Day EMA (blue line) near 10550. If the Dow can hold support near its 50
Day EMA then this could lead to an eventual oversold rally. However if the
Dow breaks below its 50 Day EMA this would likely lead to a larger drop back to
the 10400 to 10420 range which is where its 100 Day EMA (green line) and 38.2%
Retracement Level come into play at.
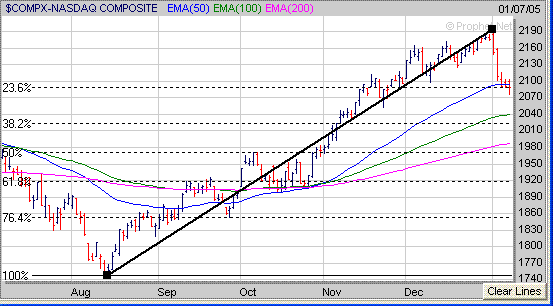
 The
Nasdaq got sold off hard this week and dropped below its 50 Day EMA (blue
line) on Friday. If the Nasdaq can find support early next week at its
intra day low on Friday near 2076 this could lead to an oversold bounce.
However if the Nasdaq continues to drop instead then its next area of support
would be in the 2020 to 2040 range which coincides with its 38.2% Retracement
Level (calculated from the August low to the late December high) and 100 Day EMA
(green line).
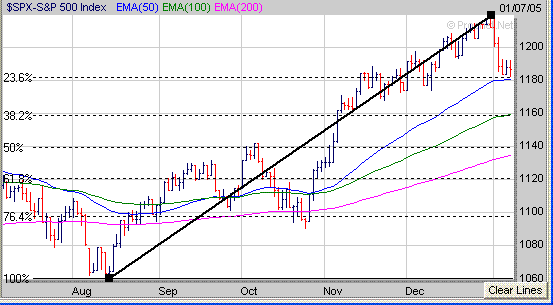
The S&P 500 has dropped back to around the 1180 level which is where its
23.6% Retracement Level (calculated from the August low to the late December
high) and 50 Day EMA have converged at. One of two things will probably
happen in the S&P 500. Either the S&P 500 will hold support near
1180 and then undergo an oversold bounce or it will break below 1180 leading to
a drop back to the 1160 area which is where its 38.2% Retracement Level and 100
Day EMA (green line) reside at.
 Meanwhile
even if the major averages can hold support near their current levels and then
undergo an oversold rally it still appears that they are potentially exhibiting
the final upward wave in conjunction with an Elliot 5 Wave Pattern. 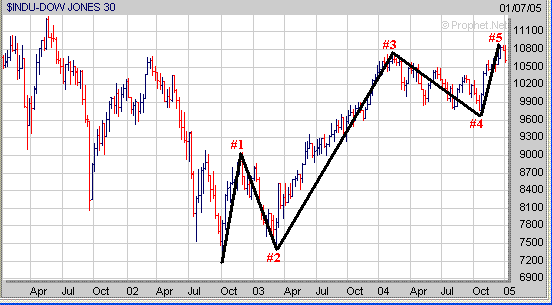
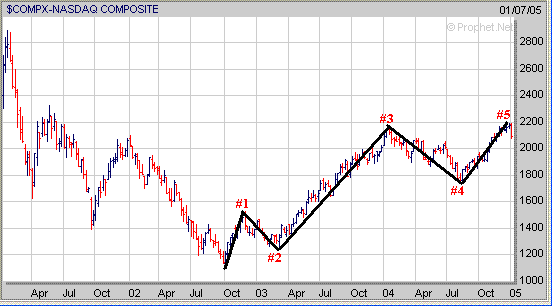
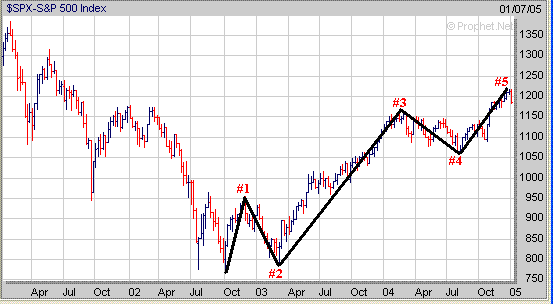
Also the current chart of
the Nasdaq looks similar to the chart of the Dow in the 1930's as the Dow
completed its 5 Wave Pattern in the early part of 1934 after making a
bottom in 1932. Furthermore once the Dow completed its 5 Wave Pattern it
then got stuck in a trading range between 85 and 110 from 1934 through the early
part of 1935 before rallying strongly from the middle part of 1935 into
1936. Of course this doesn't necessarily mean the Nasdaq will act like the
Dow did in the 1930's however their chart patterns are similar. 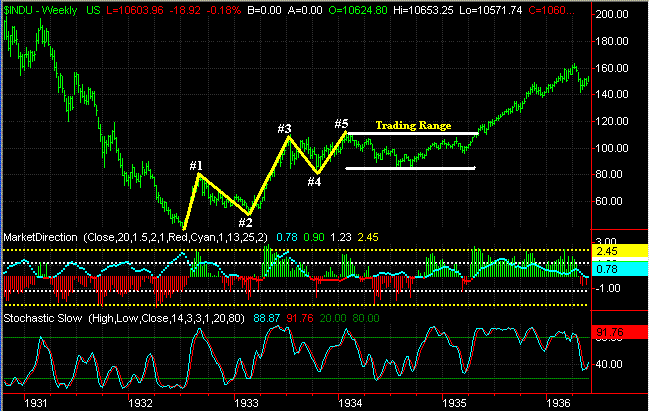
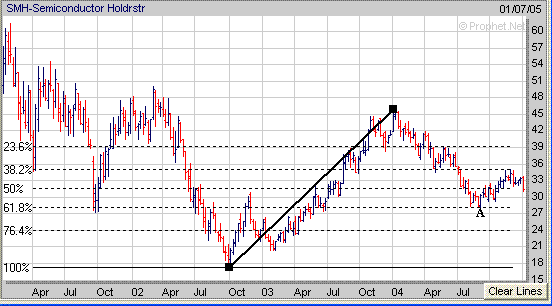
As far as a few sectors the Semiconductors continue to act poorly as the
Semiconductor Holders (SMH) had a rough week. If the SMH's continue to
breakdown they have a key longer term support area near 28 (point A) which is at
their 61.8% Retracement Level (calculated from the late 2002 low to the early
2004 high). If the SMH's continue to trend lower this will likely lead to
additional selling pressure in the Nasdaq.
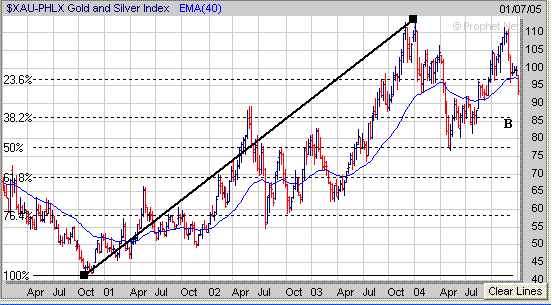
 For those following the Gold and
Silver sector (XAU) the XAU broke below a key support level this week at their
40 Weekly EMA (blue line). If the XAU continues to trend downward its next
support level would be at its longer term 38.2% Retracement Level (calculated
from the 2000 low to the early 2004 high) near 86 (point
B).
Finally although quite a few stocks got hit hard this week
continue to focus on those which are holding up well and developing a favorable
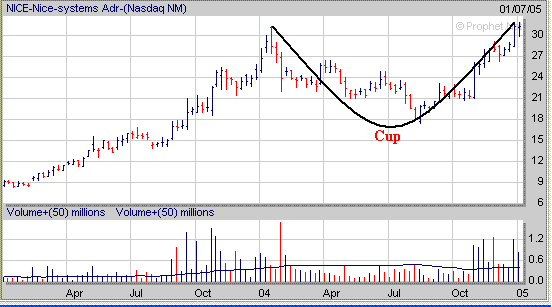
chart pattern. I recently noticed that NICE has completed the right side
of a 12 month Cup and now needs to develop a constructive Handle over the next
few weeks.
Signup today for a 2
Week Trial Membership and have access to our Stocks
to Watch List which provides a list of Stocks that are exhibiting a
favorable Chart Pattern such as the "Cup and Handle", "Double
Bottom" and "Flat Base". Also you
will receive our Daily Breakout Report
by email which Alerts you to Stocks that
are breaking out of a favorable Chart Pattern from our Stocks
to Watch List.
Click
Here to signup for a "Free" 2 Week Trial Membership
Amateur-Investor.net
|


